Alaska Fisheries Science Center
of the
National Marine Fisheries Service
2001 Agency Report
to the
Technical Subcommittee
of the
Canada-US Groundfish Committee
May 2001
Compiled by
Mark Wilkins, Tom Wilderbuer, and David Clausen
VIII. REVIEW OF AGENCY GROUNDFISH RESEARCH, ASSESSMENTS, AND MANAGEMENT IN 2000
A. Agency Overview
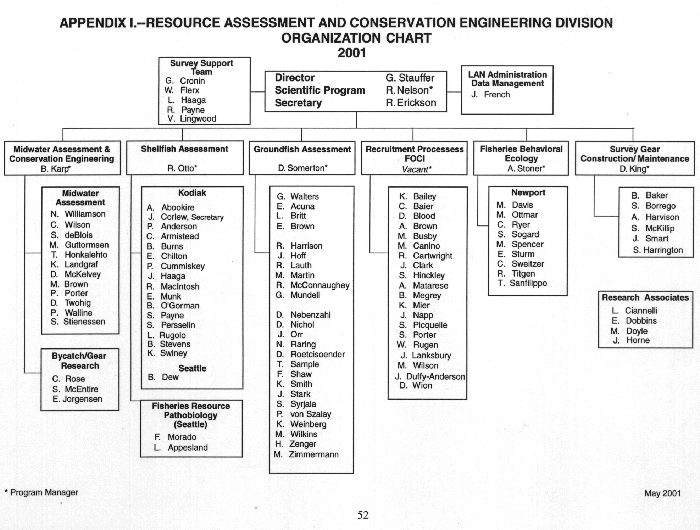
Essentially all groundfish research at the Alaska Fisheries Science Center (AFSC) is conducted within the Resource Assessment and Conservation Engineering (RACE) Division, the Resource Ecology and Fisheries Management (REFM) Division, and the Auke Bay Laboratory (ABL). The RACE and REFM Divisions are divided along regional or disciplinary lines into a number of tasks and subtasks. A review of pertinent work by these tasks during the past year is presented below. Yearly lists of publications and reports produced by AFSC scientists are available on the AFSC website at http://www.afsc.noaa.gov/Publications/yearlylists.htm . Lists or organization charts of groundfish staff of these three units are included as Appendices I, II, and III.
RACE DIVISION
In 2000 the primary activity of the Resource Assessment and Conservation Engineering (RACE) Division continued to be fishery-independent stock assessments of important groundfish species of the northeast Pacific Ocean and Bering Sea. The RACE Division changed over from a triennial to a biennial rotation of survey area emphasis in Alaskan waters in 1999. We will be surveying the Gulf of Alaska continental shelf and slope during odd years and the Aleutian Islands shelf and Bering Sea continental slope in even years. The crab and groundfish resources of the eastern Bering Sea shelf will continue to be surveyed annually. The Division will also continue the West Coast continental shelf and slope bottom trawl survey series and the echo integration/trawl survey for Pacific hake through 2001. Following this year=s surveys, the AFSC will hand over full responsibility for West Coast surveys to the NWFSC.
Three major bottom trawl surveys of groundfish resources were conducted in 2000 by RACE researchers on the eastern Bering Sea shelf, in the Aleutian Islands region, and along the eastern Bering Sea continental slope. The Midwater Assessment and Conservation Engineering (MACE) Program conducted comprehensive acoustic/trawl surveys of pollock abundance in the Bogoslof Island area and the southeastern Bering Sea shelf in February-March 2000, in Shelikof Strait in March 2000, and on the eastern Bering Sea shelf in June-August 2000. RACE and REFM scientists also conducted a feasibility study in August 2000 in an area east of Kodiak Island to evaluate whether the area was suitable for future studies on the interactions between commercial fishing, pollock, and Steller sea lions. The Recruitment Processes task conducted several Fisheries-Oceanography Coordinated Investigations (FOCI) cruises during the spring and summer of 2000, investigating the interaction between the environment and the spawning products of Gulf of Alaska and eastern Bering Sea pollock.
Dr. Art Kendall, manager of the Fisheries-Oceanography Coordinated Investigations (FOCI) program, retired at the end of 2000. Art was instrumental in developing a program with considerable expertise and worldwide reputation in the field of ichthyoplankton and larval fish research. Jennifer Lanksbury joined the FOCI program in 2002.
For more information on overall RACE Division programs, contact Division Director Dr. Gary Stauffer at (206)526-4170.
REFM DIVISION
The research and activities of the Resource Ecology and Fisheries Management Division (REFM) are designed to respond to the needs of the National Marine Fisheries Service regarding the conservation and management of fishery resources within the US 200-mile Exclusive Economic Zone (EEZ) of the northeast Pacific Ocean and Bering Sea. Specifically, REFM's activities are organized under the Observer Program and the following tasks: Age and Growth Studies, Socioeconomic Assessments, and Status of Stocks and Multispecies Assessment. Scientists at AFSC assist in preparation of stock assessment documents for groundfish in the three management regions (Bering Sea/Aleutian Islands, Gulf of Alaska, and Washington-Oregon-California), conduct research to improve the precision of these assessments, and provide management support through membership in regional groundfish management teams.
For more information on overall REFM Division programs, contact Division Director Dr. Richard Marasco at (206)526-4172.
NMFS - AFSC - AUKE BAY LABORATORY
The Auke Bay Laboratory (ABL), located in Juneau, Alaska, is a division of the NMFS Alaska Fisheries Science Center (AFSC). In recent years, ABL's Groundfish Assessment Program has been primarily involved with research and assessment of sablefish and rockfish in Alaska and with the study of fishing effects on the benthic habitat. In 2001, the groundfish program began an additional new project to study the interaction between Steller sea lions and prey/predators in Alaska. Presently, the Groundfish Program is staffed by 14 scientists. Three personnel changes occurred in the Groundfish Program during 2000/2001: longtime staff member Ken Krieger retired, Mitch Lorenz from ABL=s Habitat Program transferred into the Program, and Pat Malecha was hired to work on fishing effects studies.
In 2000 field research, ABL's Groundfish Program, in cooperation with the AFSC=s RACE Division, conducted the annual NMFS sablefish longline survey in Alaska. Other field work by ABL included 1) a manned submersible study of deepwater coral beds off southeastern Alaska to identify Habitat Areas of Particular Concern (HAPC); 2) a scuba diving study of growth rates of a shallow water coral species to help determine effects of fishing on corals of Alaska; 3) continued juvenile sablefish studies, including tagging of juveniles and a laboratory young-of-the-year sablefish growth study; 4) an ongoing genetics and plankton study to identify rockfish larvae to species; 5) a sablefish longline hook spacing experiment; 6) electronic archival tagging of sablefish during the longline survey; 7) a continuing habitat study of rockfish in nearshore areas of southeastern Alaska; and 8) development of a benthic sled to house video cameras for observing seafloor habitat. Field work on the Steller sea lion/prey interaction study also began in early 2001.
Ongoing analytic activities involved management of ABL's sablefish tag database and preparation of three annual status of stocks documents for Alaska groundfish: sablefish, slope rockfish, and pelagic shelf rockfish. Other analytic activities during the past year were: 1) a study of the use of echosounder signals to stratify trawl surveys for Pacific ocean perch and thereby improve survey precision; 2) an analysis of tag reporting rates in the Alaska sablefish fishery; 3) establishment of a sablefish logbook database and computation of longline fishery catch rates; and 4) an examination of past trawl survey data in Alaska to identify locations of coral abundance that may be affected by fishing activities. In addition, several of the staff spent considerable time helping prepare the Programmatic Supplemental Environmental Impact Statement (SEIS) for the Bering Sea/Aleutian Islands and Gulf of Alaska Groundfish Fishery Management Plans. The purpose of this extensive document was to provide an updated discussion and analysis of the environmental impacts of the groundfish fishery in Alaska.
For more information on overall Auke Bay Laboratory programs, contact Laboratory Director Dr. Michael Dahlberg at (907) 789-6001.
B. Multispecies Studies
1. Research
Bering Sea Crab/Groundfish Bottom Trawl Survey - RACE
The annual crab-groundfish demersal trawl survey of the eastern Bering Sea shelf was completed from May 23- July 20, 2000. A total of 372 stations were sampled covering over 500,000 km2 from inner Bristol Bay to the shelf edge and from Unimak Pass to 62° N near St. Matthew Island. The chartered vessels F/V Aldebaran and F/V Arcturus were used for the survey for the eighth consecutive year.
Preliminary biomass estimates for major roundfish species indicated a significant increase over 1999 for walleye pollock and a continuing downward trend for Pacific cod. Most flatfish species showed increases in abundance from the previous year. Like 1999, the survey was started approximately 2 weeks earlier than in recent years due to an earlier opening of the walleye pollock AB@ season. Bottom water temperatures in 2000 were much closer to the long term mean (long term = 2.43°, 2000 = 2.16°) than in the record cold year of 1999. As a result, the distributions of walleye pollock and Pacific cod were once again spread across the shelf.
However, as happened last year, a high incidence of the lack of new eggs in red king crab (Paralithodes camtschaticus) was found, suggesting a delay in molting. As a result, after the completion of the standard survey, the primary area of red king crab abundance was resurveyed again and a normal condition was found.
Twenty additional stations were sampled in the inshore waters of Bristol Bay to examine the feasability of adding standard stations to improve the assessment of yellowfin sole. Yellowfin sole are spawning inshore during the time of the survey and it is hoped that expanding the area sampled will allow better estimates.
For further information, contact Gary Walters, (206) 526-4143.
Aleutian Islands Biennial Groundfish Assessment Survey - RACE
The seventh comprehensive bottom trawl survey of Aleutian Island region groundfish resources was conducted from 17 May through 25 July, 2000 by the RACE Division. Previous surveys were conducted more or less triennially in 1980, 1983, 1986, 1991, 1994, and 1997. Future surveys will be conducted biennially.
Survey sampling was conducted aboard two chartered commercial trawlers using our standardized Poly Nor=Eastern bottom trawls rigged with roller gear. Sampling operations began on the north side of the Aleutian Islands between Unimak Pass (165°W) and the Islands of Four Mountains (170°W) and extended westward throughout the remainder of the Aleutian Archipelago to Stalemate Bank (170°E). The primary focus of this groundfish survey series is to build a standardized time series of data for use in assessing, describing, and monitoring the distribution, abundance, and biological condition of various Aleutian groundfish stocks. Specific objectives of the 2000 survey included 1) defining the distribution and relative abundance of the principal groundfish and commercially important invertebrate species that inhabit the Aleutian region; 2) obtaining catch and effort data from which to estimate the absolute abundance of the principal groundfish species; 3) collecting data to define various species-specific biological parameters i.e., age, sex, size, growth rates, length-weight relationships, feeding habits, spawning condition, and taxonomy; and 4) collecting data and specimens requested by other researchers or institutions.
Time lost to bad weather and gear repair was generally minimal, but during periods of extreme tidal flow, heavy currents at specific stations sometimes caused work to be postponed. Sampling generally proceeded from east to west. Some preassigned stations were not sampled due to unsuitable bottom conditions; some untrawlable stations were replaced with preselected alternate locations, or a new location within the proper area-depth stratum. Successful tows were performed at 428 of 456 assigned assessment sites. Stations ranged in depth from 20 to 471 m. Sea surface temperatures and successful bathythermograph recordings were collected at 441 stations.
Biomass was estimated for the major groundfish species using the area-swept technique. Total biomass estimates indicate that Atka mackerel and Pacific ocean perch were, by far, the dominant species in the Aleutian region as a whole, but Atka mackerel was the predominant species in the Central regulatory area. Pacific ocean perch ranked second in overall total biomass in the region, but was the most abundant species in the western Aleutian area. Northern rockfish was fourth overall in total biomass following giant grenadiers. In the southern Bering Sea area walleye pollock was the most abundant species.
The results show a striking degree of variability among some of the biomass estimates across these years, especially for species with highly contagious distributions, such as Atka mackerel, Pacific ocean perch, and northern rockfish. In general, sampling in the rough, hard-bottom areas inhabited by Atka mackerel, giant grenadiers, and the rockfishes has improved over the past decade, largely due to the expertise of our charter vessel operators. Some variability might be due to differences in survey timing. This survey was approximately 3 weeks earlier than the 1994 and 1997 surveys, which were 7 weeks earlier than the 1991 survey.
In the Aleutian Islands region, the year 2000 was the coldest year yet detected during AFSC groundfish surveys. The warmest years tend to lag about a year behind El Niño events. The coldest years thus far detected have occurred within the same decade, 6 years apart. Generally, temperatures at shallower depths vary more than at depths greater than 300 m where they are within a range of about 0.5°C or less. Perhaps the year 2000 temperatures are not as anomalous as they appear, but many individual fish were visibly thinner than during other surveys. Unfortunately, we have no data to compare for the intervening years.
Table 1. Biomass esimates (t) of major species captured during the 1991-2000 AFSC bottom trawl surveys of the Aleutian region.
|
Species |
1991 |
1994 |
1997 |
2000 |
|
Atka mackerel |
723,979 |
668,764 |
461,994 |
512,900 |
|
Pacific ocean perch |
351,093 |
383,618 |
625,273 |
511,706 |
|
Giant grenadier |
24,594 |
33,669 |
71,501 |
219,693 |
|
Northern rockfish |
215,255 |
93,289 |
87,390 |
205,348 |
|
Pacific cod |
189,190 |
184,109 |
83,416 |
136,075 |
|
Walleye pollock |
180,088 |
117,198 |
158,912 |
128,015 |
|
Arrowtooth flounder |
21,809 |
57,978 |
73,893 |
64,470 |
|
Pacific halibut |
39,490 |
61,379 |
66,248 |
49,619 |
|
Northern rock sole |
*37,326 |
*54,786 |
49,897 |
44,078 |
|
Shortraker rockfish |
23,703 |
28,190 |
38,487 |
37,782 |
|
Kamchatka flounder |
15,485 |
49,041 |
37,664 |
28,479 |
|
Rougheye rockfish |
11,131 |
14,552 |
11,596 |
15,259 |
|
* Grouped rock sole species in 1991 and 1994 |
||||
For further information, contact Harold Zenger, (206)526-4158.
Bering Sea Continental Slope Bottom Trawl Pilot Survey - RACE
The RACE Division=s Groundfish Task completed a pilot bottom trawl survey of the groundfish and shellfish resources of the eastern Bering Sea continental slope (BSCS) aboard the chartered commercial trawler Morning Star between June 16 and July 20, 2000. The vessel worked along the continental slope of the eastern Bering Sea from Akutan Island toward the northwest, sampling predetermined stations at depths between 180 and 1,100 meters. The objectives of the investigation were somewhat exploratory in nature, to gain a familiarity with the area, habitats, and biota that will be sampled when we begin a new biennial bottom trawl survey series in 2002.
Another objective was to determine the type of trawl needed to sample this habitat appropriately. Since this region was reputed to be quite rugged, we needed to determine whether a rough-bottom sampling trawl, capable of sampling marginally trawlable bottom, was necessary. Using such gear often requires us to sacrifice some of our ability to collect smaller demersal fish and invertebrates that can escape under the larger ground gear. Therefore, last summer=s work included a study comparing the ability of two different configurations of the RACE Division=s Poly Nor=Eastern sampling trawl to sample all species and sizes of demersal fish and shellfish in this habitat. Two hauls were made at each station using trawls rigged with different types of ground gear.
We successfully completed paired trawl hauls at 56 of the 58 planned stations. Two stations in the deepest stratum were abandoned due to untrawlable bottom. Only four tows resulted in unsatisfactory performance (three due to torn nets and one due to the net Amudding down@). Mean path widths of the mudsweep and rockhopper trawls were 14.94 and 14.02 m, respectively, with corresponding mean net heights of 7.24 and 8.35 m.
Average catch rates of the mudsweep gear were higher than those of the rockhopper gear in all depth strata except the shallowest. Average catch rates in the shallowest stratum were strongly influenced by large catches of Pacific ocean perch, and the largest of those catches (>16 t) was made with the rockhopper net. With Pacific ocean perch excluded, the average catch rate of the mudsweep gear in the shallowest stratum exceeded that of the rockhopper gear by 46%. These preliminary results suggest that the mudsweep gear we currently use for the West Coast continental slope survey would sample the biota better and that the survey area can be adequately sampled without resorting to the rough-bottom rockhopper sampling trawl.
For more information, contact Mark Wilkins, (206)526-4104.
West Coast Trawl Survey of Upper Continental Slope Groundfish Resources - RACE
The RACE Division completed a four-week bottom trawl survey of the upper continental slope groundfish resources off Washington, Oregon, and California on November 9, 2000. The survey covered the upper continental slope habitat 183-1,280 m deep in the International North Pacific Fisheries Commission (INPFC) U.S. Vancouver, Columbia, Eureka, Monterey, and northern Conception statistical areas (U.S./Canada border-lat. 34°30=N). Sampling for the survey began near the U.S./Canada border in Ninitat Canyon and progressed southward toward Point Conception. We successfully sampled 207 of 208 possible stations during the survey. Results from annual groundfish slope surveys are used by fishery managers to assess stock conditions and establish annual harvest guidelines for sablefish (Anoplopoma fimbria), Dover sole (Microstomus pacificus), and two species of thornyhead rockfish (Sebastolobus alascanus and S. altivelis). This was the twelfth survey in an ongoing series to monitor long-term trends in the distribution and abundance of WCUCS groundfish populations.
For more information, contact Bob Lauth, (206)526-4121.
Fisheries Behavioral Ecology Program - RACE
This research program focuses on understanding the role that behavior plays in regulating the growth, distribution, abundance and survival of economically and ecologically valuable fish species. Two major groups of laboratory studies are conducted. Bycatch research focuses on the potential for recovery of juvenile and adult walleye pollock, sablefish, lingcod and halibut that initially survive capture or are otherwise impacted by fishing gear. Behavioral ecology research focuses on larval, juvenile and adult stages of walleye pollock, sablefish and halibut and their responses to changing environmental conditions and how these influence distribution, growth and survival.
Bycatch studies are aimed at evaluating: 1) the potential for long-term survival following capture; 2) whether fish that survive capture suffer deficits in behavioral and physiological capabilities that may compromise their ability to feed successfully and avoid predation; 3) whether the capability of surviving and recovering from capture differs with age and species; 4) how environmental factors interact with stresses imposed by capture to influence survival and recovery of behavioral and physiological capabilities. Recent results have shown that in walleye pollock, sablefish and halibut, survival and recovery of orientation, recognition of species mates, feeding, predator evasion and baseline physiology after capture is dependent on gear type (towed net or longlining) and the types of interactions between fish and fishing gear. New research has shown that the fate of fish escaping from trawls is not well known and may represent a large and unspecified source of indirect fishing mortality. The light conditions in a net are important, with fish under dark conditions being unable to orient or swim, a condition that results in greater injury, behavioral deficits and mortality. Sensitivity to capture stress varies among ages and species, with walleye pollock being the most sensitive species, followed by sablefish, halibut and lingcod and younger fish being more sensitive than older fish, a result that shows that generalizations about bycatch stress, behavioral deficits and mortality among species is not possible. Elevated temperature plays a major role in the magnification of stress that is induced by capture. Exposure of sablefish, halibut or lingcod to temperatures ranging from 12 to16°C after capture, a condition that is similar to thermocline conditions and deck conditions off the northwest coast of the U.S. and Canada during the summer, results in magnification of behavioral and physiological deficits as well as mortality. Clearly, management of fisheries stocks should consider the impact of seasonally elevated temperature on the increase in bycatch stress and mortality for all gear types.
Behavioral ecology studies on various stages of walleye pollock, sablefish and halibut include experimental analysis of feeding and growth, predator/prey interactions and social interactions (schooling and resource competition) in response to physical gradients of light, temperature, and mixing and temporal and spatial distribution of food, predator threat and social interactions. Results are assessed in conjunction with field studies to help improve sampling surveys, predict responses by fish to changes in their environment, help define critical habitat for economically and ecologically important species and ultimately, predict survival and recruitment potential.
For further information, contact Michael Davis, (541) 867-0256 .
Fisheries Resource Pathology Program - RACE
The Fisheries Resource Pathobiology sub-task continued its monitoring effort of potentially important diseases of juvenile walleye pollock, red (Paralithodes camtschaticus) and blue (P. platypus) king crab, four species of tanner crabs (Chionoecetes bairdi, C. opilio,C. tanneri, and C. angulatus), and Atka mackerel during the 2000 survey season. Juvenile walleye
pollock (20 - 90 mm) were collected from the Bering Sea and will be microscopically examined to determine the prevalence and distribution of diseases that may lead to mortality prior to recruitment age. To determine the distribution and prevalence of Bitter Crab Syndrome caused by the parasitic dinoflagellate Hematodinium sp., hemolymph smears were collected from C. bairdi and C. opilio from the Bering Sea shelf and from C. tanneri and C. angulatus from the Bering Sea slope. Ongoing studies of disease prevalence and distribution in red and blue king crab were continued during the 2000 survey season. Tissue samples were fixed and will be microscopically examined to determine disease affects on population abundance and distribution.
In 1999 and 2000, tumors were discovered in the body cavities of Atka mackerel found in the Aleutian Islands. Upon microscopic examination a protistan parasite, Myxosporidia sp., was found to be associated with the affected tissues and tumor masses. We have not yet determined what, if any, role the parasite or tumors play in the survivability of Atka mackerel.
For further information, contact Dr. Frank Morado, (206) 526-6572 .
Age and Growth Task - REFM
The Age and Growth Program, of the REFM Division, serves as the Alaska Fisheries Science Center's ageing unit for groundfish species. The program consists of a biometrician, age validation researcher, data manager/technician, and 9 age readers. Ages are usually determined from otoliths, but scales and/or finrays are sometimes used.
Data provided by the program are used in stock assessment modeling, which contributes to the estimation of the allowable catch of many commercially important groundfish species. These species include walleye pollock, Pacific whiting, Pacific cod, sablefish, Pacific Ocean perch, northern and dusky rockfishes, Atka mackerel, yellowfin sole, rock sole, rex sole, and misc. sole and rockfish species.
Craig Kastelle recently completed a radiometric study with Joan Forsberg, of the IPHC, using young 5-7yr old halibut collected in 1960. The measurement of Pb-210 and Ra-226 in these old samples provides clues as to whether the assumption of no leakage of radon from otoliths is valid. This assumption is required when applying Pb-210/RA-226 radiometric ageing to fish otoliths. The results were not definitive due to the extremely low levels of radium present in the otoliths. However, a brief paper describing these results is being written for publication.
Still continuing is a study with the NMML to apply radiometric ageing to gray and bowhead whales. The laboratory work has been completed, and results will be analyzed and submitted for publication. Preliminary results suggest that the method may possibly be applicable to gray whales, but not bowhead whales. The problem appears to be excess lead found in the bullae of bowhead whales.
Nancy Roberson should soon complete her thesis concerning problems ageing Alaska Pacific cod. She has prepared thin sections that were used along with imaging equipment and Optimas software to measure otolith rings. Results from these measurements were used to help determine ageing criteria, and whether miss-ageing had occurred. Otoliths from tagged Pacific cod enabled the selection of a back calculation method and an indirect validation of ageing criteria. Although not answering all questions, this thesis should provide a basis for the return of Pacific cod to production ageing.
Jon Short and Chris Gburski are working on a study to use otolith shape analysis, and other measurements, as a tool to distinguish arctic cod from walleye pollock. At small fish sizes, walleye pollock can be extremely difficult to distinguish from arctic cod, and pollock otolith collections may be contaminated with other species. Otolith analysis can provide a good method of detecting collector error.
The Age and Growth Program recently hired Wes Shockley, (Univ. Of South Florida, B.S. (94), M.S. (97); both in zoology).
For further information contact Dr. Daniel K. Kimura (206) 526-4200.
Resource Ecology and Ecosystem Modeling - REFM
Groundfish stomach sample collection and analysis
The Resource Ecology and Ecosystem Modeling Task continued regular collection of food habits information on key fish predators in the North Pacific. Collection of groundfish stomach samples is primarily through the RACE bottom trawl and echo-integration/trawl surveys. Additional samples that broaden our spatial and seasonal coverage are obtained through the Observer Program and through coordinated studies with other agencies. In 2000, we collected samples during bottom trawl surveys of the Aleutian Islands and the eastern Bering Sea shelves and upper continental slopes. Observers collected stomach samples during fishery operations from the eastern Bering Sea. In total, 10,592 stomachs were collected from the eastern Bering Sea and 4,174 from the Aleutian Islands. Laboratory analysis was conducted on 5,429 fish stomachs from the Bering Sea, 2,864 from the Gulf of Alaska and Aleutian Islands, and 1,787 from the west coast regions.
Multispecies, foodweb, and ecosystem modeling and research is ongoing. Documents, symposia and workshop presentations, and a detailed program overview are available on the World Wide Web. These can be viewed from the Alaska Fisheries Science Center (AFSC) web site at: http://www.refm.noaa.gov/reem/.
Ecosystem modeling- Eastern and Western Bering Sea Shelves
A comparison, in collaboration with Russian researchers, of two mass-balance food web models of the 1980s eastern and western Bering Sea shelves, revealed structural differences which may arise through the difference in biogeography between the regions. The eastern Bering Sea ecoregion primarily consists of a wide continental shelf, while the western Bering Sea has an extremely narrow shelf in comparison with its slope area. As a result, the western Bering Sea possesses approximately twice the level of primary and secondary pelagic production per unit area, as higher production occurs over the slope rather than on the shelf. However, much of this extra energy is lost between lower and upper trophic levels in the western Bering Sea, due to the differences in supported fish communities in the two regions. The eastern Bering Sea possesses a larger per-unit-area biomass of most higher trophic level fish guilds.
In both systems, primary production follows two distinct pathways to higher trophic levels: (1) the pelagic pathway, through pelagic zooplankton, forage fish, and cephalopods and (2) the benthic pathway, through benthic zooplankton, infauna, epifauna, and small flatfish. The transfer of energy through pelagic pathways is proportionately similar in both systems. However, the flow of energy through the benthic pathways differs substantially, especially between trophic levels 3 and 4.
In the eastern Bering Sea, a complex community of small flatfish species, especially yellowfin sole, rock sole, flathead sole, and Alaska plaice, provides a major energy conduit between benthic invertebrates and higher trophic levels. These small flatfish may, as a guild, represent a keystone component of the ecosystem on the eastern Bering Sea shelf. This community is considerably smaller in the western Bering Sea, where an extremely high density of epifauna, such as brittlestars and sea urchins, consume a large proportion of benthic material without passing it up the food chain. On higher trophic levels (4+), Pacific cod seems to be a keystone predator in both ecosystems. The determination of keystone species and points in the food web of at which top-down and bottom-up control occurs is being explored further through sensitivity analysis of the two food webs.
Additionally, this work brought together data and aided in evaluating data quality, and served as a backdrop for comparing different methods for estimating food consumption in groundfish species. Sensitivity analyses point to the importance of analyzing food habits and growth rates of fish over their entire life history when measuring their impact on ecosystem dynamics. A next, important step in this work is to improve the quantification of highly migratory animals, especially marine mammals, in the two models.
Environmental Impact Analysis
A comprehensive analysis of the impacts of the Alaskan groundfish fisheries on the environment was performed. Members of the REEM program provided background information on groundfish food habits and benthic habitat. Ecosystem-level impacts of alternative fishery management regimes were also evaluated. A draft of the full analysis is available on the web at
http://www.fakr.noaa.gov/sustainablefisheries/seis/default.htm
.For more information please contact Pat Livingston at (206)526-4242.
2. Stock Assessment
Status of Stocks and Multispecies Assessment Task - REFM
The Status of Stocks and Multispecies Assessment Task is responsible for providing stock assessments and management advice for groundfish in the North Pacific Ocean and the Bering Sea. In addition, Task members conduct research to improve the precision of these assessments, and provide technical support for the evaluation of potential impacts of proposed fishery management measures.
During the past year, stock assessment documents were prepared by the Task for the Gulf of Alaska and Bering Sea/Aleutian Islands Groundfish Plan teams of the North Pacific Fishery Management Council and for the groundfish management team of the Pacific Fishery Management Council.
Assessment scientists provided analytic assistance on many current fisheries management issues. These included: 1) identification and prioritization of research activities that may lead to improved groundfish stock assessments; 2) modeling of groundfish stock structure; 3) contribution to a comprehensive report on bycatch, utilization and discards; 4) helped to develop overfishing definitions for the NPFMC, 5) provided analysis of environmental impacts of the pollock and Atka mackerel fisheries on Steller sea lions, and 6) worked with the NMFS Alaska Region to provide a supplemental environmental impact statement for the setting of TACs.
Research activities spanned a broad range of topics. Field studies initiated by staff members included the continuing development of a demersal rockfish trawl for improved stock assessment and hydroacoustic approaches for rockfish habitat determination. Significant research contributions on: 1) the examination of climatic effects on the recruitment of North Pacific groundfish species, 2) relationship of Bering Sea oceanography to pollock recruitment, 3) modeling the Pacific whiting fishery behavior, 4) analysis of the geographic and genetic variation in Atka mackerel in the Aleutian Islands, and 5) incorporation of predation in the Gulf of Alaska pollock assessment were presented at various symposia. In addition, staff members participated on nationwide NMFS committees for specifying a precautionary approach to fisheries management; used a Leslie depletion model to analyze Atka mackerel fishery CPUE data; investigated restratifying fisheries data along biological lines as opposed to traditional INPFC areas; worked with other fishery labs in developing and implementing a new stock assessment model, and continued the international cooperative analysis of Bering Sea pollock stocks with Russian scientists. Staff members also served on national and international steering committees of GLOBEC and PICES.
For further information, contact Dr. Anne Hollowed (206) 526-4223.
3. Management
North Pacific Groundfish Observer Program - REFM
The North Pacific Groundfish Observer Program is responsible for placement of observers on vessels fishing for groundfish species in the U.S. EEZ of the northeastern Pacific Ocean and Bering Sea. Observers collect data, which provide the basis for in-season management of the groundfish fisheries by NMFS, provide a means for evaluating and developing management strategies by regional management councils and NMFS, and are used in the stock assessment process. Observers play important roles in providing information that is critical to the U.S. fishing industry.
During 2000, no foreign vessels were allowed to catch or process fish in the U.S. EEZ along the west coast and Alaska. The Observer Program trained and deployed 878 observers to vessels fishing off Alaska, and the Washington-Oregon-California coast. The Program was responsible for defining the sampling duties and data collection methods used by observers, training of the observers prior to deployment, debriefing of observers upon their return, and editing and managing the resulting data. The catch data were provided to the Alaska and Northwest Regional Offices to assist in management decisions regarding the catches of groundfish and prohibited species. Data were also collected regarding the operations of the groundfish fishery.
Observer Program Review
An extensive, independent review of the Observer Program began in late 1999. The review was carried out by Marine Resources Assessment Group (MRAG) Americas, Inc. MRAG is an independent consulting firm which provides professional advice and services for the management of marine fisheries throughout the world. The purpose of this review was to provide recommendations for changes in Program operations and organization which might improve the Program=s ability to meet its mission and goals. Their final report along with a response from the AFSC was made available to the North Pacific Fishery Management Council at it=s meeting in September 2000.
Two key recommendations in the MRAG report involved the reestablishment of Program goals and objectives and the development of a contractual relationship between NMFS and the observer provider companies. Reestablishing goals and objectives will be an important first step in guiding and defining the role and future direction of the Observer Program. The development of a contractual relationship between NMFS and the observer companies is an initiative toward the elimination of any real or perceived conflicts of interest between the observer companies and the fishing fleet they service. As a first step, the Observer Program is proposing the development of a pilot contract using the American Fisheries Act (AFA) catcher processor and mothership fleet. Under this arrangement, the AFA fleet would be required to seek their observer coverage from the observer company that holds that contract with NMFS. The contract is envisioned as a Ano-cost@ arrangement where the observer company receives payment for their services directly from the AFA fleet and must abide by the performance standards of the contract in order to retain their exclusive rights to provide observers to the AFA fleet. This contractual arrangement will place the NMFS Observer Program in the role of Aclient@ in the eyes of the observer company and will significantly reduce any perceived or actual conflict of interest between the AFA fleet and the current observer companies that service that fleet.
In addition to the MRAG review, the Observer Program was also reexamined this year along with all other NMFS observer programs, through the annual NMFS management control review (MCR) process. The newly established, National Observer Program Advisory Team (NOPAT) was actively involved in this endeavor. NOPAT is made up of representatives from all NMFS regional offices, science centers and observer programs and is coordinated through the National Observer Program office of NMFS. The AFSC=s Observer Program contribution to the MCR report was completed in late September and the entire national MCR report was made available the following month.
Observer Program ACadre@ Takes Shape
New office space in Anchorage was designed, constructed and leased in the Federal building annex during 2000, to house ten new Observer Program employees. These new employees along with the existing two positions in Anchorage will make up the Observer Program ACadre.@ The cadre is an inherently flexible unit of employees that can be deployed as needed to ports throughout Alaska. They help to increase the Observer Program=s presence in the field and allow for more Afront line@ communication between NMFS, observers and the fishing industry. Todd Loomis, the Anchorage field office manager, was selected to lead the Cadre. The first five employees to join the Cadre were hired in December.
2nd Biennial Us-Canada Fisheries Observer Program Workshop
Several AFSC Observer Program staff participated in the 2nd biennial US-Canada Fisheries Observer Program Workshop in St. John=s Newfoundland from June 26-29, 2000. The first workshop was hosted by the AFSC in 1998 and was developed to bring together some of the key organizations responsible for the design, management and delivery of at sea fisheries observer programs in the U.S. and Canada. The second such biennial workshop was expanded in scope to include greater representation from the fishing industry and observers. Two, currently active and highly experienced, North Pacific groundfish observers attended the workshop. The workshop=s objectives were as follows:
CDQ and AFA Fisheries
Implementation of an expanded Community Development Quota (CDQ) program and implementation of provisions of the recently enacted American Fisheries Act (AFA) continued during 2000. The CDQ program was developed for the purpose of allocating fishery resources to eligible Western Alaska communities to provide the means for starting or supporting commercial fishery activities that would result in ongoing, regionally based, commercial fishery or related businesses. CDQ was initiated in 1992 with pollock and expanded to include fixed gear halibut and sablefish in 1995. In 1998, it was further expanded to include multiple species of groundfish and crab (MSCDQ). In 1999, NMFS was responsible for monitoring the groundfish (including pollock and sablefish) and halibut CDQs and the State of Alaska was responsible for monitoring the crab CDQs. This division of responsibility continued into 2000.
The AFA, enacted by Congress in late 1998, made changes to the pollock fishery in the Bering Sea and Aleutian Islands. These changes included reallocation of fish among industry segments, provided for the formation of fishing cooperatives, and increased observer coverage levels on some components of the fleet. The offshore component of the fleet organized a fishing cooperative in 2000 and received increased, mandatory observer coverage. Also during 2000, the Observer Program was involved in implementation of aspects of the AFA related to shoreside pollock. The shoreside component proved to be more complex then offshore and involved NMFS regulatory actions and a changing role for the observer.
MSCDQ and AFA catch accounting for offshore processors is based entirely on data collected by observers and, unlike the open access fisheries, where observer data is used to manage a fleet wide quota, industry participants in the MSCDQ and AFA fisheries require individual accounting of fish harvested in each haul or set. This change in expectations placed on observers, their data, and the Observer Program in general, has required much Observer Program staff effort in the development of special selection criteria and training requirements for observers, development of new sampling strategies and regulations to enhance the observer=s working environment, and changes to the data collection and data management software systems.
For further information or if you have questions about the North Pacific Groundfish Observer Program please contact Dr. Daniel Ito, (206) 526-4194.
Socioeconomic Assessment Program - REFM
During 2000, the Socioeconomic Assessments Program was actively involved in preparing the Draft Programmatic Supplemental Environmental Impact Statement for the Bering Sea/Aleutian Islands (BSAI) and Gulf of Alaska (GOA) groundfish fisheries. This included analyzing the economic effects of the alternatives and developing a mathematical optimization model that includes equality and inequality constraints to solve for the catch and bycatch of each species. The constraints included the catch and bycatch quotas by fishery for each alternative and year as well as the historical species composition of catch and bycatch in the various groundfish fisheries. Fisheries were defined by area, gear and target species.
Other activities included the following: (1) efforts to improve the basic economic data that are available to assess the economic performance of the BSAI and GOA groundfish fisheries and to evaluate the economic effects of alternative fishery regulations; (2) the economic analysis of sea lion protection measures in the pollock, Pacific cod and Atka mackerel fisheries; (3) preparing a qualitative assessment of excess fishing capacity in federally managed commercial fisheries off Alaska; (4) providing assistance in the preparation of the NMFS National Fishing Capacity Task Force report on defining and measuring fishing capacity; (5) providing assistance in the preparation of the NMFS guideline for the economic analysis of fishery management actions; and (6) assisting with the economic analysis of guideline harvest level (GHL) and individual fishing quota (IFQ) alternatives for the Alaska charter boat halibut fishery.
In addition papers were prepared on the following topics: (1) measuring fishing capacity; (2) cost-earnings survey design issues; (3) the use of random utility models in commercial fishing; (4) non-market valuation; (5) recreational fishery attributes, participation rates and regional economic impacts; (6) modeling the economic effects of marine protected areas (MPA); (7) location choice theory; and (8) common property institutions in the Alaska groundfish fisheries.
For further information contact Dr. Joe Terry (206) 526-4253.
C. By species, by agency
1. Pacific cod
b. Stock Assessment
BERING SEA/ALEUTIANS
The present assessment updates last year's assessment, incorporating new catch and survey information. This year's EBS bottom trawl survey resulted in a biomass estimate of 528,000 t, a 9% decrease from last year=s estimate and the lowest observed value for the survey. The Aleutian Islands were surveyed in 2000; the biomass increased 63% from 1997. Estimates of abundance are higher for the 2000 assessment compared to the 1999 assessment. For example, estimated 2001 spawning biomass for the BSAI stock is 369,000 t, up about 10% from last years projection of harvest at the FABC level for 2001. Since reliable estimates of B40%, F40%, and F35% exist for this stock, Pacific cod qualify for management under tier 3 of the BSAI Groundfish FMP. The updated point estimates of B40%, F40%, and F35% from the present assessment are 389,000 t, 0.29, and 0.35, respectively. Fishing at a rate of 0.29 is projected to result in a 2001 spawning biomass of 369,000 t, and solves the equation for the maximum permissible value of FABC under tier 3. Because projected biomass for 2001 is less than B40%, Pacific cod qualify for management under sub-tier Ab@ of tier 3. Fishing at an instantaneous rate of 0.29 is projected to result in a 2001 catch of 214,000 t, which is the maximum permissible ABC under Amendment 56. However, the assessment author recommended setting the 2001 ABC at 188,000 t, 12% below the maximum permissible level. The recommendation was based on a risk-averse optimization procedure which considers uncertainty in the estimates of the survey catchability coefficient and the natural mortality rate in the computation of an F40% harvest level. The Bayesian meta-analysis which has formed the basis for a risk-averse ABC recommendation in each of the last four years was not performed for the present assessment. Instead, the ratio between last years recommended FABC and F40% (0.87) resulting from the Bayesian meta-analysis was assumed to apply this year as well.
The Plan Team of the NPFMC indicated that a 12% reduction from the maximum permissible ABC is justified not only on the basis of these decision-theoretic concerns, but also because estimated spawning biomass from the model has declined continuously since 1988 and also because four of the last five year classes recruited to the population (assessed at age 3) appear to have been well below the long-term average. A 2001 catch of 188,000 t would represent a decrease of 2% over the 2000 ABC of 193,000 t, the same direction as the 9% decrease in the trawl survey biomass estimate. Spawning biomass projected for 2001 is 38% of its unfished level. Spawning biomass is projected to decline through 2004. ABC reaches a minimum of 150,000 t in 2003. A 2001 catch of 188,000 t corresponds to a fishing mortality rate of 0.28, below the value of 0.29 which constitutes the upper limit on FABC under tier 3b.
The overfishing level was also determined from the tier 3b formula, where fishing at a rate of 0.32 gives a 2001 catch of 248,000 t. Model projections indicate that this stock is neither overfished nor approaching an overfished condition.
GULF OF ALASKA
Only size composition and total catch data from the 1999 and January-August 2000 commercial fisheries (federal and state) were incorporated into the 2000 Pacific cod assessment model. The Bayesian meta-analysis that has formed the basis for a risk-averse ABC recommendation in each of the last four years, was not performed. Instead, the ratio between last year=s recommended FABC and F40% (0.87) was assumed to apply this year as well.
The estimated 2001 spawning biomass for the GOA stock is 93,800 mt, down about 15% from last year=s estimate for 2000 and down about 7% from last year's FABC projection for 2001. The estimated 2001 total age 3+ biomass for the GOA stock is 526,000 mt, down about 7% from last year=s estimate for 2000 and down about 5% from last years F40% projection for 2001. While the population is still projected to decrease, it is still above the estimated B40% level.
The recommended 2001 ABC for the GOA stock of 67,800 mt was obtained by applying the ratio of 0.87 to the updated model fit. This is down about 11% from last year's recommendation for 2000 and down about 5% from last year=s FABC projection for 2001. The estimated 2001 OFL for the GOA stock is 91,200 t, down about 11% from last year's estimate for 2000.
Apportioning the ABC between regulatory areas in proportion to the biomass estimates from the most recent trawl survey, results in the following: Western-36% , Central-57%, and Eastern-7%, which would result in 24,400 mt, 38,650 mt, and 4,750 mt, respectively.
For further information, contact Dr. Grant Thompson at (206) 526-4232.
3. Shelf Rockfish
a. Research
Distribution and Habitat of Rockfish in Nearshore Waters of Southeast Alaska
Scientists in the ABL Habitat Program continued to assess the distribution, habitat, and behavior of rockfish in nearshore waters of Southeast (SE) Alaska. Sampling methods included use of a beach seine to capture fish in shallow (<10 m deep), vegetated habitats (e.g., eelgrass meadows, understory kelps) and a remotely operated vehicle (ROV) to record in situ observations of rockfish in deeper water (10-90 m) habitats such as vertical bedrock walls and complex bottoms of boulders or broken rock. To date, 123 seine hauls and 208 ROV dives have been completed at 37 sites throughout SE Alaska. Of the over 30 species of rockfish known to occur in Alaska, 16 species were captured or observed in nearshore waters of SE Alaska. Shallow, vegetated habitats were frequented by juvenile black, brown, copper, dusky, and quillback rockfish. Tagging studies showed that juvenile (age >1) copper rockfish moved into shallow, vegetated habitats in early summer and remained there for up to four months. Young-of-the-year rockfish appeared in nearshore, vegetated habitats in August. Most (>75%) observations of rockfish with the ROV were over complex bottoms of boulder and rock or in vertical bedrock wall habitats. Few rockfish were observed over soft bottoms with no relief. Rockfish observed with the ROV included black, canary, china, copper, dusky, harlequin, Puget Sound, quillback, rosethorn, silvergray, tiger, yelloweye, and yellowtail rockfish. Median depth of observation was <30 m for black, copper, dusky, and yellowtail rockfish and >30 m for all other species. Size of fish observed ranged from 10 to 60 cm; fish size was positively correlated (P <0.036) with depth for dusky, quillback, and yelloweye rockfish. Species often observed alone were China (67%), copper (46%), quillback (46%), and rosethorn (43%) rockfish. Most (>70%) observations of harlequin, Puget Sound, silvergray, tiger, and yelloweye rockfish were in mixed species assemblages. When first observed, the behavior of most rockfish species was swimming or hovering. Notable exceptions were China, harlequin, rosethorn, and tiger rockfish; 33-57% were resting on bottom or in a hole or crevice. Studies in 2001 will focus on identifying seasonal patterns in abundance and factors (e.g., temperature, salinity) that may influence rockfish distribution in nearshore waters of SE Alaska.
For more information, contact Scott Johnson at (907) 789-6063.
b. Stock Assessment
GULF OF ALASKA
Pelagic Shelf Rockfish
The pelagic shelf rockfish assemblage is comprised of three species that inhabit waters of the continental shelf of the Gulf of Alaska and that are thought to exhibit midwater, schooling behavior. At certain times, however, some of these fish are caught in bottom trawls. Dusky rockfish is by far the most abundant species in the group, and has been the target of a bottom trawl fishery since the late 1980's. Two varieties of dusky rockfish are seen: an inshore, dark-colored form, and a light-colored variety found offshore. The trawl fishery takes the light variety. Recent taxonomic work indicates these two forms are separate species, and a publication presenting this information is currently in preparation by Jay Orr of the AFSC RACE Division.
Similar to previous years, ABC for the assemblage in 2001 is calculated using biomass estimates based on trawl survey data. Gulfwide exploitable biomass, 66,443 mt, is based on the average of the biomasses estimated for the assemblage in the three most recent trawl surveys of this region (those in 1993, 1996, and 1999). Almost all this biomass comes from dusky rockfish. Applying an F=M strategy to this biomass, in which the annual exploitation rate is set equal to the estimated rate of natural mortality for dusky rockfish (0.09), yields a Gulfwide ABC of 5,980 mt for 2001.
Work is presently in progress on applying an age-structured model for the first time to assess stock condition of light dusky rockfish. This model is expected to be used in this year=s assessment to help determine a recommended ABC for light dusky rockfish in 2002.
For more information, contact David Clausen at (907) 789-6049 or Jon Heifetz at (907) 789-6054.
4. Slope Rockfish
a. Research
GULF OF ALASKA
Stratifying by Echosounder Signal to Improve Trawl Survey Precision for Pacific Ocean Perch
In 1998 color sonar signals were recorded on paper during individual trawl hauls conducted in a study of rockfish, Sebastes spp., survey methods by the Auke Bay Laboratory. Visual sonar categorization criteria were developed on a subset of the data based on signal patterns and shapes and color. Blind tests on a subset of 38 of these hauls were then conducted by individual scientists. Between scientist agreement of high and low categories varied from 76-87% The trawl catch rates in the test subset were divided into 14 low catch rates and 24 high catch rates. High and low sonar categorizations corresponded with high and low catch rates 66-78% of the time Data were collected again in 1999 and categorized using the same criteria. Onboard scientists agreed with categorizations done by a shoreside scientist on 65% of 49 categorizations. The trawl catch rates in the 1999 study were divided into high and low catch rates and the scientists= sonar categorizations corresponded with catch rates on 59% and 61% of the hauls for the shoreside and onboard scientists, respectively. The vessel captains were asked to rate the sonar signals and 61% of their categorizations corresponded with the catch rates. Variance estimates that would result from simple double sampling (Cochran 1977) using the sounder categorizations as strata definitions were predicted using the observed within-category variances at various levels of first stage (sonar) sampling. Sonar samples are considerably less expensive in time and cost than trawl sampling and if 10 times as many sonar samples are taken to stratify the trawl samples, variance improved 18-37% compared to simple random sampling, depending on the data set and the categorizer. If trawl hauls were allocated optimally, the improvement increased from 44-60% over simple random trawl hauls. To match the variance obtained by double sampling with sonar primary sampling, the number of random trawl hauls would have to be increased 1.8-2.5 fold depending on data set and categorizer.
For more information, contact Jeff Fujioka at (907) 789-6026.
Species Identification of Rockfish Larvae and Other Larval Rockfish Studies
Rockfish (Sebastes spp.) larvae and early post-larvae present most vexing problems in marine ecology. As a group they are abundant in the spring and early summer zooplankton, where they may have important trophic roles. Single plankton samples may have six species of rockfish and within a small sampling area eight and possibly more species may be present in the plankton. As many as 27 species have been tentatively identified from a single 10-day cruise in the eastern Gulf of Alaska. Although easily identified to genus, specific identification using morphology and pigmentation patterns is very difficult. ABL scientists, in cooperation with Dr. Anthony Gharrett and Andrew Gray of the University of Alaska Fairbanks, are attempting to resolve some of the problems using genetic techniques. In this study, pigmentation patterns of larval and post-larval rockfish have been compared with genetic identifications. Early attempts to use allozymes to identify species of rockfish larvae were inconclusive. In 1996, we showed that an alternative genetic technique, recombinant mitochondrial DNA (mtDNA), can be used to identify single larvae at much smaller and earlier stages than allozyme technology. Subsequently, 14 of 33 rockfish species known to occur in the inside waters of southeastern Alaska have been identified in plankton samples from this area.
Because several of the species found in this study as preflexion larvae have identical or nearly identical pigment patterns, it now appears that pigment patterns will be useful only to identify subgeneric groups or species complexes. Therefore, this research suggests that genetic examination of individual rockfish larvae may be necessary to obtain a positive identification to species. Clearly, genetic identification of every rockfish larva in a large plankton sampling program is impractical due to cost and manpower constraints. To reduce the cost and time of genetic analysis, we tested a refinement of our field plankton sampling technique during an August 2000 cruise of the NOAA vessel John N. Cobb. Using an 80-cell block instead of individual vials, all rockfish larvae were separated from the samples. If proven practical, this may allow us to statistically estimate species composition of rockfish larvae in a sampling area.
During this same cruise we tried to capture larger postflexion rockfish larvae. A surface- towed small Isaacs-Kidd midwater trawl caught a few 15-30 mm rockfish juveniles. Best success was when the net was deliberately towed in or through drifting kelp. This lends support (but not poof) to the hypothesis that rockfish aggregate about drifting seaweed or seek a structured bottom habitat at a very early stage. Unfortunately, because drifting seaweed was very sparse during the cruise we were not able to adequately test the hypothesis.
For more information, contact Bruce Wing at (907) 789-6043.
b. Stock Assessment
BERING SEA AND ALEUTIAN ISLANDS
Rockfish
The POP complex consists of true POP (Sebastes alutus) and four other red rockfish species (northern rockfish, rougheye rockfish, sharpchin rockfish, and shortraker rockfish). Prior to 1991, the complex was managed as a unit in each of the two management areas. Since 1991, however, the North Pacific Fisheries Management Council has managed S. alutus separately from the other species in both areas, and has also split out rougheye and shortraker in the Aleutians. This was done to avoid excessive catches of the less abundant members of the complex, particularly shortraker and rougheye. Beginning in 1996, the ABC and TAC for true POP have been subdivided within the AI area, based on an average of the biomass estimates from the two most recent trawl surveys: Eastern subarea 25%, Central subarea 25%, and Western subarea 50%.
True POP, Eastern Bering Sea
The most recent assessment incorporates new catch information into the stock assessment model and indicates that the total biomass of POP in the eastern Bering Sea is 50,000 t, nearly the same level as the past fifteen years. Since reliable estimates of B40%, F40%, and F35% exist for this stock it therefore qualifies for management under Tier 3 of the BSAI Groundfish FMP. The updated point estimates of B40%, F40%, and F35% from the present assessment are 21,500 t, 0.049, and 0.058, respectively. Projected spawning biomass for 2001 is 18,100 t, placing POP in the EBS in sub-tier "b" of Tier 3. The maximum FABC value allowed under Tier 3b is computed as follows:
FABC £ F40% ´(B2001 /B40%-0.05)/(1-0.05) = 0.049´(18,100/21,500-0.05)/0.95 = 0.040
Projected harvesting at a fishing mortality rate of 0.040 gives a 2001 catch of 1,730 t (last year=s ABC was set using a higher fishing mortality rate, 0.054, in part because last year=s B40% estimate of 26,200 t was higher than this year=s estimate of 21,500 t).
The OFL fishing mortality rate is computed under Tier 3b as follows:
FOFL = F35%´(B2001 /B40%-0.05)/(1-0.05)= 0.058´(18,100/21,500-0.05)/0.95 = 0.048
Projected harvesting at a fishing mortality rate of 0.048 gives a 2001 catch of 2,040 t. Model projections indicate that this stock is neither overfished nor approaching an overfished condition.
True POP, Aleutians
The present assessment incorporates updated catch information and age composition data into the stock assessment model and indicates that the total biomass of POP in the Aleutian Islands region is 233,000 t, about the same level of abundance estimated for the past 11 years after rebuilding from low levels in the late 1970s. Reliable estimates of B40%, F40%, and F30% exist for this stock, which qualifies it for management under Tier 3 of the BSAI Groundfish FMP. The updated point estimates of B40%, F40%, and F35% from the present assessment are 89,100 t, 0.062, and 0.073, respectively. Projected spawning biomass for 2001 is 84,900 t, placing true POP in the Aleutians in sub-tier "b" of Tier 3. The maximum FABC value allowed under Tier 3b is computed as follows:
FABC £ F40% ´(B2001 /B40%-0.05)/(1-0.05) = 0.062´(84,900/89,100-0.05)/0.95 = 0.059
Projected harvesting at a fishing mortality rate of 0.059 gives a 2001 catch of 10,200 t. The ABC is apportioned among AI subareas based on survey distribution as follows: Western AI = 46.5%, Central AI = 25.1% , and Eastern = 28.4%, corresponding to 4,749 t (W), 2,563 t (C), and 2,900 t (E).
The OFL fishing mortality rate is computed under Tier 3b as follows:
FOFL = F35%´(B2001 /B40%-0.05)/(1-0.05)= 0.073´(84,900/89,100-0.05)/0.95 = 0.069
Projected harvesting at a fishing mortality rate of 0.069 gives a 2001 catch of 11,800 t. Model projections indicate that this stock is neither overfished nor approaching an overfished condition.
Other Red Rockfish, Aleutian Islands and Eastern Bering Sea
The Groundfish Plan Team of the NPFMC recommended that separate chapters be prepared for S. alutus and the combined Aother red rockfish@to improve the clarity of the assessment and facilitate better understanding of the methodology used and the results obtained. It was also recommended that the assessment authors examine the possibility of specifying area-specific OFLs, ABCs, and TACs for the shortraker/rougheye complex and a combined-area OFL, ABC, and TAC for the northern/sharpchin complex, as well as including catch and survey data by individual species to determine if differential harvest rates exist.
Through 2000, the other red rockfish complex was split out into northern/sharpchin and rougheye/shortraker groups in the AI, and a combined other red rockfish group for the eastern Bering Sea. The assessment authors provided an assessment for these species groups, by incorporating recent catch data and the 2000 AI survey results.
For 2001, the complex was broken out to separate species for management. The was done for conservation reasons, because when managed as a species complex, there is a risk that one stock would be fished disproportional to its abundance, resulting in overfishing of that stock. This is especially true when one species has a higher value to the fishery that the other species. This has happened in the other red rockfish complex, and a recent appendix to the assessment showed that on a species basis, catches have sometimes exceeded what OFL would have been. This occurred for rougheye rockfish in the AI in 1997, and northern rockfish in the Bering Sea in 2000. Establishing ABCs on a species by species basis would help prevent overfishing.
There are further economic and management issues to be addressed by splitting out the other red rockfish category since the low abundance of rockfish in the EBS would be very constraining to the fleet. The low OFL calculated for the 2001 EBS other red rockfish complex (180 mt) could greatly impact the 2001 fisheries. The 2000 catch was 228 mt even though it was on bycatch status all year. Other target fisheries could be shut down, or prohibited to retention, to prevent the OFL from being exceeded.
For each species the FABC was set at the maximum value allowable under Tier 5, which is 75% of M. Accepted values for M are: rougheye rockfish--0.025, shortraker rockfish--0.030, and northern rockfish--0.060. Multiplying these rates by the best estimates of species-specific biomass gives the following 2001 ABC=s:
|
Northern Rockfish (BSAI) |
6,760 mt |
|
Rougheye Rockfish (BSAI) |
262 mt |
|
Shortraker Rockfish (BSAI |
766 mt |
Note that sharpchin rockfish are at the extent of their range in the BSAI, and are not common. Therefore, no specifications for this species are recommended.
There is some risk associated with establishing area-wide ABCs if there are truly separate stocks of shortraker and rougheye rockfish in the AI and EBS. For rougheye rockfish, there has been some genetic samples collected in the EBS, but most of the research to date has been done in the Gulf of Alaska. To address this concern, the TACs for these species are apportioned among BS and AI areas. Apportionments of the full ABC based on average (1991-2000) survey biomass are:
|
|
BSAI |
|
|
Northern |
19 mt (0.3%) |
6,741 mt (99.7%) |
|
Rougheye |
32 mt (10.9%) |
230 mt (89.1%) |
|
Shortraker |
84 mt (11.0%) |
682 mt (89.0%) |
The overfishing level (OFL) was determined from the Tier 5 formula, where setting FOFL=M for each species gives 2001 OFLs:
Northern Rockfish (BSAI) - 9,020 mt
Rougheye Rockfish (BSAI) - 349 mt
Shortraker Rockfish (BSAI) - 1,020 mt
For further information, contact Paul Spencer at (206) 526-4248.
GULF OF ALASKA
Slope rockfish are defined as those species of Sebastes that, as adults, inhabit waters of the continental slope and outer continental shelf, generally in depths greater than 150-200 m. Twenty-one species of rockfish are classified into the slope assemblage, the most abundant of which are Pacific ocean perch, and northern, rougheye, redstripe, sharpchin, shortraker, silvergray, and harlequin rockfish. Until recently, the stock abundance of slope rockfish, especially Pacific ocean perch, was considered to be quite depressed compared to its former abundance in the early 1960's. The most recent trawl surveys of the Gulf of Alaska in 1996 and 1999 showed a substantial increase in biomass of Pacific ocean perch. This increase followed another large increase in biomass seen in 1993, and suggests that current abundance of Pacific ocean perch is much improved in comparison with its formerly depressed condition. Age structured models are applied to Pacific ocean perch and northern rockfish. This is the first year that an age structured model has been applied to northern rockfish. Based on these models, the best estimate of exploitable biomass for Pacific ocean perch in the Gulf of Alaska is now 211,190 mt, similar to last year=s estimate of 200,310 mt, and the exploitable biomass for northern rockfish is 93,850 mt. Exploitable biomass for all other species in the assemblage is estimated from the average values in the 1993, 1996 and 1999 trawl surveys, and totals 173,400 mt.
To prevent possible over-exploitation of the more desirable species, the slope rockfish assemblage is divided into four subgroups: Pacific ocean perch, shortraker/rougheye rockfish, northern rockfish, and other slope rockfish. Separate ABC's are assigned to each subgroup. Pacific ocean perch and northern rockfish are presently managed using an F40% strategy adjusted for relative spawning biomass. The other subgroups are managed under an F=M strategy, in which the annual exploitation rate is set equal to or less than the rate of natural mortality. The 2001 ABC's are as follows: Pacific ocean perch, 13,510 mt; shortraker/rougheye rockfish, 1,730 mt; northern rockfish, 4,880 mt, and other slope rockfish, 4,900 mt.
For more information, contact Jonathan Heifetz at (907) 789-6054, James Ianelli at (206) 526-6510, or David Clausen at (907) 789-6049.
Rockfish Age-structured Modeling Workshop
A rockfish (Sebastes spp.) modeling workshop was held at the ABL February 20-22, 2001. The workshop was attended by stock assessment scientists from NMFS REFM Division in Seattle and from ABL. The goal of the workshop was to implement a common model framework for a number of different rockfish populations managed by NMFS. A simple age-structured model (with allowance for size composition data) was agreed upon as a base model and constructed with AD Model Builder Software. The base model was applied to the following Gulf of Alaska stocks: Pacific ocean perch (POP), northern rockfish, dusky rockfish, and rougheye rockfish. Additionally, the model was applied to the Aleutian Islands and Eastern Bering Sea POP stock and may be applied to the POP stock off the coast of Washington and Oregon. Since each stock has particular differences in fishery, survey, and biology, features were added to the base model to account for additional data types and special fishery characteristics. The base models will be tuned by individual stock assessment scientists to their particular stocks and the patterns of information will be compared among these stocks for the specific common model. The base model will also be evaluated for sensitivity to assumptions for the different stocks. Results will be summarized in a NOAA technical publication.
For more information, contact Dean Courtney at (907) 789-6006.
West Coast
Pacific Ocean Perch
Pacific ocean perch catches are characterized by large removals during the mid-1960s by foreign vessels. The domestic fishery proceeded with subsequent moderate removals of between 1,000-2,000 tons per year since 1976. Catches have been further reduced by management measures to about 700 tons since 1995. In 1999 the catch was estimated at slightly higher than 500 tons and for 2000, the catches are estimated at slightly less than 300 tons.
Previous assessments were done in 1992 and 1995 and involved extensive analyses of diverse data types using an age structured model (the stock synthesis program). In 1998, and in this assessment, a similar model structure was implemented. The new data presented in this assessment include updated catches, a revised length-at-age transition matrix, updated commercial length frequency data, and the 1998 NMFS triennial-trawl survey estimate of biomass and age structure. There were a number of changes in model structure from that used in the 1998 assessment. A non-informative prior was placed on steepness and a very diffuse prior was placed on the trawl survey catchability estimates reflecting the lack of relevant auxiliary information. Also the population was not assumed to be at equilibrium at the start of the fishery and that the stock size at the beginning of the fishery (1956) was consistent with the variability that might be expected based on observed recruitment variability.
As in past assessments, the estimates of current stock status are uncertain and conditional on assumptions about the data and the model. The 1998 survey age composition data provides the first information of year class strengths observed in the 1990s (age composition was not determined for the 1995 survey) and there is evidence of three Astrong@ year classes. These values are not well determined, but show some promise of improved stock status. The most recent assessment evaluated a wide range of models to present a clearer depiction of the model structure and how the data are providing insight on stock condition. This involved running three distinct types of models. These were simply 1) an age-structured production model (with no recruitment stochasticity), 2) an age-structured model with no underlying estimate of productivity model, and 3) an age-structured production model with recruitment stochasticity. The 3 models (and variants) were evaluated with respect to implications regarding trawl survey catchabilities. These catchabilities are shown to be negatively correlated with productivity estimates. The sensitivity of model results to assumptions about prior distributions on stock-recruitment parameters were also evaluated. A number of sources of uncertainty complicate the scientific interpretation of the results in this assessment. The authors attempted to develop a model that encompasses greater realism in this uncertainty. For example, uncertainty was allowed in natural mortality, total catch (by weight) estimates, the spawning biomass and recruitment relationship, and in the survey catchability coefficients. For sensitivity analyses, other plausible alternatives suggest that the overall uncertainty may be greater than that predicted by a single model specification.
It is likely that the current management plan (i.e., bycatch only) is not conducive to accurate estimates of removals from the fishery. The assessment relies heavily on the accuracy of removals from the fishery. Accurate estimates of landings and unaccounted fishing mortality (e.g., discard mortality) are crucial to the assessment of the fishery and the subsequent derivation of management reference points. Underestimation of removals, associated with lack of trends in the survey indices, is likely to lead to an overly pessimistic assessment of the fishery.
The recruitment pattern for POP is similar to many rockfish species. Recent decades have provided rather poor year-classes compared to the 1950s and 1960s. This assessment is the first to have new information on POP recruitment in the 1990s. POP otolith samples from the 1995 NMFS survey had not been aged for previous assessment. Given limited resources to age samples, the 1998 survey otoliths were read for age determinations.
The exploitation status of POP continues to be set to bycatch only. Since POP are at the southern limit of their geographical range, while the overall species condition has improved in other areas more central to their range (e.g., in the Canadian EEZ and in the Gulf of Alaska). Management actions of setting harvest guidelines to bycatch only (ABC=0) implemented over the past several years has not yet resulted in observable stock increases based on available data.
Forecasts for the next three years under an FMSY policy and for F50% harvest rates are very similar and are as follows:
|
Year |
F50% |
FMSY |
|
2001 |
831 |
834 |
|
2002 |
877 |
880 |
|
2003 |
918 |
921 |
Findings suggest that there is some probability (~15%) that the current stock level is below 50% of the target (BMSY) stock size. Based on these results, we recommend harvests should remain at minimal levels until substantive stock increases are observed.
For further information, contact Dr. James Ianelli at (206) 526-6510.
6. Sablefish
a. Research
BERING SEA, ALEUTIAN ISLANDS, AND GULF OF ALASKA
Sablefish Longline Survey
The AFSC has conducted an annual longline survey of sablefish and other groundfish in Alaska from 1987-2000. The survey is a joint effort involving two divisions of the AFSC: ABL and RACE. It replicates as closely as practical the Japan-U.S. cooperative longline survey conducted from 1978-94 and also samples gullies not sampled during the cooperative longline survey. The eastern Bering Sea, Aleutian Islands region, and Gulf of Alaska were sampled during the cooperative longline survey, but the AFSC longline survey sampled only the Gulf of Alaska until 1996, when biennial sampling of the Aleutian Islands region and eastern Bering Sea was added. The Aleutian Islands region was sampled in 2000. In 2000, 73 stations were sampled in the Gulf of Alaska and 14 stations were sampled in the Aleutian Islands from 1 June to 5 September. Sixteen kilometers of groundline were set each day, containing 7,200 hooks baited with squid. The survey vessel was the chartered fishing vessel Alaskan Leader. Sablefish was the most frequently caught species, followed by giant grenadiers, Pacific cod, arrowtooth flounder, and Pacific halibut. A total of 76,351 sablefish, with an estimated total round weight of 255,919 kg (564,301 lb), was taken during the survey.
A total of 3,092 sablefish, 492 shortspine thornyhead, and 37 Greenland turbot were tagged and released during the survey. Length-weight data and otoliths were collected from 2,079 sablefish.
Killer whales preying on sablefish and Greenland turbot caught on the gear were observed at one Aleutian Islands station and one Gulf of Alaska station, and may have affected catch rates at these stations.
For more information, contact Chris Lunsford (907) 789-6008 or Michael Sigler at (907) 789-6037.
Sablefish Longline Hook Spacing Experiment
In addition to the sablefish longline survey, a longline hook spacing experiment also was conducted from the chartered fishing vessel Alaskan Leader near Yakutat on 25-26 July 2000. The purpose of the experiment was to test an assumption on how to interpret longline fishery catch rates. The fishery catch per skate is assumed to be an index of relative abundance. For example, a 10% difference in catch rate reflects a 10% difference in relative abundance. This assumption would be wrong if increasing the hook spacing increased the fishing power of each hook. Most (about 70%) sablefish longline fishermen currently use 1 meter hook spacing, but this spacing differs between vessels and may change with time. In the hook-spacing experiment, circle hooks (size 13/0) baited with squid were used. Four hook spacings were tested: 0.5, 1, 2, and 4 m. Six sets were completed. Each set contained all hook spacings. For this experiment and earlier hook spacing experiments conducted in 1986 and 1999, catch rate per hook increased as hook spacing increased to an asymptote at 4-m spacing.
Catch per hook for 1-m spacing, the most common spacing currently used in the fishery, was about half that for the 4-m spacing. These results imply that analysis of fishery catch rates should be standardized by longline set to account for differences in hook spacing. These data are being used to improve an equation for standardizing catch rate differences associated with hook spacing. We are now computing standardized fishery catch rates annually which are included in the sablefish stock assessment.
For more information, contact Chris Lunsford (970) 789-6008 or Michael Sigler at (907) 789-6037.
Sablefish Logbook Database Near Completion
A sablefish logbook program was initiated by ABL in 1999 to collect detailed fishery information to better understand fishery characteristics and improve the sablefish assessment in Alaska. Vessel logbooks are required from sablefish longline vessels over 60 feet in length. Voluntary logbooks are also submitted by vessels less than 60 feet and are included in the data set when available. The individual logbook sheets are designed to collect catch and effort information for all sablefish sets made by a vessel. With this information, catch rates for the fishery can be computed and compared to catch rates from the NMFS longline survey. The 1999 and 2000 sablefish logbooks have been received and key punched and logbook sheets for 2001 are currently being collected. The logbook database is expected to be operational by summer 2001.
Preliminary work on fishery catch rates was conducted in 1999 using data collected by the domestic observer program. The analysis of catch rate trends is an important step in incorporating both survey and fishery data into the management process. More extensive analysis of fishery data is warranted because some fishermen are concerned that their catch rates have remained strong in some areas despite declines in longline survey catch rates. Using data from the sablefish logbook program and the domestic observer program, fishery catch rates were computed and included in the 2000 sablefish assessment model.
For more information, contact Chris Lunsford (970) 789-6008 or Michael Sigler at (907) 789-6037.
ABL Sablefish Tag Recovery Program
Processing tag recoveries and administration of the reward program continued during 2000. Recoveries total 725 for the year so far, which is about the same as in 1998 and 1999. Over 18% of the fish recovered in 2000 had been at liberty for over 15 years. The two fish at liberty the longest (27.5 years) were both tagged in Chatham Strait in 1973. One was recovered in Chatham Strait and one off the coast of Vancouver Island. Tagging continued on the 2000 sablefish longline survey, with 3,092 sablefish tagged and released.
A total of 660 recoveries from a joint NMFS/ADFG study conducted in Clarence Strait from 1979 to 1983 were obtained from ADFG and entered into the database. Database releases, including adults and juveniles, now total 303,514. There are 23,360 recoveries to date.
An additional 930 sablefish were tagged and released on three seamounts in July during the longline survey vessel transit from the Western to Eastern Gulf of Alaska. Seamount tagging began last year to determine whether fish which travel to the seamounts ever return to the slope. Six tags from 1999 seamount releases were recovered on the slope in 2000, verifying that seamount to slope migration does occur. Also in 2000, seven tagged fish were recovered on the same seamounts where they were released; to date no seamount-tagged fish have been recovered on a different seamount. Seamount tagging will continue in 2001.
Seamount sablefish populations share several characteristics quite different from slope sablefish. Only older fish are found on the seamounts, and males outnumber females as much as 12 to 1 in samples taken so far. Otoliths from 1999 samples processed by Delsa Anderl of the REFM Age and Growth Task in Seattle were extremely difficult to read due to the unusually compressed growth pattern. The average age in the seamount sample was far older and fish size at age was smaller than longline survey samples.
For more information, contact Nancy Maloney at (907) 789-6060.
Estimation of Tag-reporting Rates for Sablefish
ABL scientists recently completed a study in which they estimated tag-reporting rates for the sablefish fishery in Federally-managed waters of Alaska during 1980B1998. To estimate these rates, tag returns in the fishery were compared to tag returns from sablefish longline surveys that have been conducted in Alaska where all tag recoveries were assumed to be reported. When pooled over geographic areas or years, estimates of reporting rates were reasonably precise with coefficients of variation (CVs) usually less than 25%. Reporting rates were highest in the central (0.384) and eastern (0.315) Gulf of Alaska, intermediate in the western Gulf of Alaska (0.269) and lowest in the Aleutians (0.174) and eastern Bering Sea (0.169). Rates pooled over all areas increased from lows of 0.102-0.248 in 1980-1982 to a peak of 0.465 in 1985 before declining to 0.199 in 1986 and 0.157 in 1987. The reporting rate increased gradually and fluctuated between 0.376 and 0.483 since 1995. The increase in reporting in 1995 was coincidental with the implementation of the Individual Fishing Quota (IFQ) system. The linear increase in reporting rates during 1986-1998 was significant. Factors that may have influenced the reporting rate were the number of tags available for recovery, the length of the commercial season, the presence of scientific observers on commercial vessels, and the tag reward program. Pooled over all years and areas the tag-reporting rate has been 0.273 with a CV of 4.2%.
For more information, contact Jon Heifetz at (907) 789-6054.
Archival Sablefish Tags
During the 1998 and 2000 sablefish longline surveys, a combined total of about 330 sablefish were surgically implanted with an electronic archival tag. Two fish were tagged and released at each station from the eastern Aleutian Islands throughout the Gulf of Alaska to Dixon Entrance. The archival tag contains a computer chip that records depth and temperature for a period of 1-1/2 to 2 years. Data from these tags will provide information about sablefish behavior in the sea as well as the marine environmental conditions they experience. To date, twenty tags have been recovered. A $500 reward per tag is being offered to fishermen for the recovery of these tags. Plans are to release an additional number of sablefish with implants of archival tags during the 2001 longline survey.
Based on the recovered tags, three daily movement patterns have been observed: random movement (irregular depth movements not related to time of day), diel vertical movement (greater depths during day and movement to shallower water at night), and reverse diel vertical movement (shallower depths during day and movement to deeper water at night). All twenty fish exhibited random movement, eighteen fish exhibited diel vertical movement, and six fish exhibited reverse diel vertical movement. Random movement was the most commonly observed behavior, occurring 87% of the time. Diel vertical movement occurred 11% of the time and reverse diel movement occurred 2% of the time. During random movement, individual fish traveled a wide depth range, sometimes several hundred meters during 1-2 days. Vertical migration occurred in bouts with vertical migration frequently occurring for periods of several days or weeks, preceded and followed by months with no vertical migration. This plasticity in movement pattern presumably represents prey-switching. Vertical migration occurred throughout the year and no obvious seasonal pattern was apparent. The shallow depth of the diel vertical movement range typically was 250 meters, the approximate depth of the continental shelf break in the Gulf of Alaska, where invertebrates and small fish concentrate; sablefish may vertically migrate to this depth to feed at night.
For more information, contact Michael Sigler at (907) 789-6037.
Juvenile Sablefish Studies
Juvenile sablefish studies have been conducted by ABL in Alaska since 1984 and were continued in 2000. A total of 744 juvenile sablefish (age 1+) were tagged and released during a cruise of the NOAA vessel John N. Cobb at St. John Baptist Bay near Sitka, in June 2000. This cruise has been conducted annually since 1985, and relatively large numbers of juvenile sablefish have been found in this small bay each year except for 1999. This is the only known location in Alaska where juvenile sablefish have been consistently found. A young-of-the-year (YOY) sablefish study, which started in 1995, was conducted again in 2000 using the survey vessel Alaskan Leader opportunistically during the sablefish longline survey. A small-mesh surface gillnet was fished at night at offshore locations in the Gulf of Alaska to capture YOY sablefish. Mean lengths of YOY sablefish caught in the gillnets during these surveys have ranged from 10 to 19 cm. In the 2000 survey, 27 surface gillnet sets were completed which yielded a low number of YOY sablefish (only 138 total) relative to most previous years. Both the juvenile tagging and YOY sablefish studies will be continued in 2001.
For more information, contact Thomas Rutecki at (907) 789-6051.
Young-of-the-Year Sablefish Age and Growth in the Gulf of Alaska
Ageing of juvenile sablefish from their sagitta otoliths has been completed by ABL for fish collected in the Gulf of Alaska from 1995-99. Age determinations were used to calculate growth rates which showed that some relationship may exist between year class strength, estimated from age-structured modeling of adult sablefish, and growth of young-of-the-year (YOY) sablefish. Juvenile sablefish age determination methods and results from 1995-1999 were presented at the Western Groundfish Conference, April 24-28, 2000 in Sitka, Alaska.
Experiments were conducted to validate and verify the daily periodicity of otolith increment deposition in YOY sablefish. The validity of daily increment formation was tested by chemically marking the otoliths of YOY sablefish held in captivity at ABL. Approximately 30 YOY sablefish were captured along the continental shelf by NMFS staff and returned alive to ABL on June 1, 2000. The fish were maintained in sea water tanks at ABL for up to 104 days. The water temperature was elevated and held at a constant 13 degrees C and the photo period was lengthened and held at a constant 16 hrs of light per day. The fish were split into three groups of roughly equal size. The otoliths of the fish in each group were marked twice by immersing the live fish in seawater with elevated levels of SrCl2. For each group, the strontium immersions were separated by a period of approximately 15 days. The first group was marked twice in June, the second was marked twice in July and the third was marked twice in August. The fish from each group were sacrificed approximately 15 days after the second strontium immersion. The otoliths of marked fish are being processed into thin sections and the strontium markers will be detected with electron scanning microscopy by staff at the University of Alaska Fairbanks. For each processed otolith, the number of micro-increments (alternating light and dark bands visible under a transmitted light compound microscope) between detected strontium bands will be counted and compared to the number of days between SrCl2 immersions.
For more information, contact Dean Courtney at (907) 789-6006.
Young-of-the-Year Sablefish Abundance, Growth, and Diet in the Gulf of Alaska
ABL scientists synthesized basic life history information on young-of-the-year sablefish abundance, growth, and diet to determine whether forecasting year class abundance based on young of the year surveys was practical. Surface gillnet surveys were conducted annually from 1995 to 1999 along the seaward edge of the continental shelf of Alaska (see section above on AJuvenile Sablefish Studies@). Sablefish made up about one-third of the catch and were caught mostly in the central and eastern Gulf of Alaska. Growth averaged 1.2 mm d-1. The mean date the first otolith increment formed, April 30, implied an average spawning date of March 30. Diet was mainly euphausiids. Growth rate tended to be higher in years when gillnet catches were higher, but no relationship was apparent between diet and gillnet catches. Data for the synthesis was drawn from work conducted in recent years by NMFS staff from ABL and from the AFSC in Seattle. Much of this work was presented at the Western Groundfish Conference, April 24-28, 2000 in Sitka, Alaska. The results are detailed in a manuscript accepted for publication by the Alaska Fishery Research Bulletin.
For more information, contact Mike Sigler at (907) 789-6037.
b. Stock Assessment
BERING SEA, ALEUTIAN ISLANDS, AND GULF OF ALASKA
The sablefish assessment shows that sablefish abundance increased during the mid-1960's due to strong year classes from the late 1950s and 1960s. Abundance subsequently dropped during the 1970s due to heavy fishing; catches peaked at 56,988 mt in 1972. The population recovered due to exceptional year classes from the late 1970s; spawning abundance peaked again in 1987. The population then decreased as these exceptional year classes began dying off.
The longline survey abundance index decreased 10% in numbers and 8% in weight from 1999 to 2000. These decreases follow increases from 1998 to 1999 in the survey abundance index of 10% in numbers and 5% in weight and in the fishery abundance index of 7% in weight, so that relative abundance in 2000 is similar to 1998. Fishery abundance data for 2000 were not analyzed because the fishery was still open at the time the assessment was completed. Exploitable and spawning biomass are projected to increase 3% and 4%, respectively, from 2000 to 2001. Alaska sablefish abundance now appears low and stable. This confirms the conclusion from last year=s assessment that the abundance trend has changed from low and slowly decreasing to low and stable. Abundance is projected to continue to increase slowly; the size of the increase depends on the actual strength of the above-average 1997 and 1998 year classes.
A simple Bayesian analysis was completed by examining the effect of uncertainty in natural mortality and survey catchability on parameter estimation. A decision analysis was completed using the posterior probability from the Bayesian analysis to determine what catch levels likely will decrease abundance. The decision analysis indicates that a yield of 16,800 mt will maintain spawning biomass. The maximum permissible yield from an adjusted F40% strategy is 16,900 mt, which was the 2001 ABC accepted by the North Pacific Fishery Management Council for the combined stock, similar to the 2000 ABC of 17,300 mt (2% decrease).
For more information, contact Mike Sigler at (907) 789-6037 or Sandra Lowe at (206) 526-4230.
7. Flatfish
b. Stock assessments
BERING SEA
Yellowfin sole
Two abundance estimators (trawl survey and age structure model) indicate that the yellowfin sole resource increased slowly during the 1970s and early 1980s to a peak during the mid-1980s and that the resource has remained abundant and stable since that time. This trend is consistent with the fact that yellowfin sole is a slow-growing species which has been lightly exploited while experiencing average to strong recruitment during the past 18 years.
The present assessment includes incorporation of new catch and survey information. This year's EBS bottom trawl survey resulted in a biomass estimate of 1,580,000 t, an increase of 21% from last year=s survey, but still a 32% decline from 1998. The sharp decrease in 1999 was attributed in part to cold water which might have decreased availability. However, both the 1999 and 2000 trawl survey lower estimates may be due to the survey being performed earlier, when a significant portion of the stock is still at the spawning grounds in shallow water. Extra tows were done outside the normal trawling area (in shallow waters) and concentrations of yellowfin sole were encountered. An AI trawl survey was also performed and caught yellowfin sole in only two tows, of less than 20 kg each. The biomass estimate for the AI is not included in the model due to the relatively low catch. Model results estimated the yellowfin sole total biomass at over 2.3 million t and is projected to increase further in the near future when the strong 1991 year class maximizes its cohort biomass.
Reliable estimates of B40%, F40%, and F35% exist for this stock, and therefore qualifies for management under Tier 3 of the BSAI Groundfish FMP. The updated point estimates of B40%, F40%, and F35% from the present assessment are 502,000 t, 0.11, and 0.13, respectively. Given that the projected 2001 spawning biomass of 742,000 t exceeds B40%, the ABC and OFL recommendations for 2001 were calculated under sub-tier Aa@ of Tier 3. FABC was set at the F40% (=0.11) level, which is the maximum permissible level under Tier 3a. Projected harvesting at the F40% level gives a 2001 ABC of 176,000 t.
The Plan Team=s OFL was determined from the Tier 3a formula, where an F35% value of 0.13 gives a 2001 OFL of 209,000 t. Model projections indicate that this stock is neither overfished nor approaching an overfished condition.
Rock sole
The present assessment includes use of year-specific weight-at-age schedules, and incorporation of new catch and survey information. The 2000 EBS bottom trawl survey resulted in a biomass estimate of 2,130,000 t, a 26% increase relative to last year's estimate, and very similar to the 1998 trawl survey estimate. An Aleutian Island trawl survey was also performed and resulted in a biomass estimate of 46,000 t, which represents only 2% of the BS/AI rock sole combined biomass estimate from the trawl surveys. The biomass estimate for the AI is not included in the model due to the low relative catch. The stock assessment model indicates a high and abundant population estimated at 1.94 million t in 2001, a decline of 28% from the peak estimate of 2.7 million t in 1995. The decline is due to lower than average recruitment during the 1990s, however the stock is very lightly exploited.
Reliable estimates of B40%, F40%, and F35% exist for this stock, and that this stock therefore qualified for management under Tier 3 of the BSAI Groundfish FMP. The updated point estimates of B40%, F40%, and F35% from the present assessment are 285,000 t, 0.16, and 0.19, respectively. Given that the projected 2001 spawning biomass of 676,000 t exceeds B40%, the ABC and OFL recommendations for 2001 were calculated under sub-tier Aa@ of Tier 3. FABC was set at the F40% (=0.16) level, which is the maximum permissible level under Tier 3a. Projected harvesting at the F40% level gives a 2001 ABC of 230,000 t.
The overfishing level was determined from the Tier 3a formula, where an F35% value of 0.19 gives a 2001 OFL of 273,000 t. Model projections indicate that this stock is neither overfished nor approaching an overfished condition.
Flathead sole
The present assessment is a straightforward update of last year's assessment, incorporating new catch and survey information into the length-based assessment model. This year's EBS bottom trawl survey resulted in a biomass estimate of 399,000 t, a 1% increase relative to last year=s estimate. Model results indicate that the flathead sole population peaked at 874,000 t in 1992 and has since declined 29% to 618,000 t in 2000 due to a lack of recruitment during the 1990s. Exploitation remains light.
Reliable estimates of B40%, F40%, and F35% exist for this stock, and therefore is qualified for management under Tier 3 of the BSAI Groundfish FMP. The updated point estimates of B40%, F40%, and F35% from the present assessment are 134,000 t, 0.30, and 0.38, respectively. Given that the projected 2001 spawning biomass of 268,000 t exceeds B40%, the ABC and OFL recommendations for 2001 were calculated under sub-tier Aa@ of Tier 3. FABC was set at the F40% (=0.30) level, which is the maximum permissible level under Tier 3a. Projected harvesting at the F40% level gives a 2001 ABC of 84,000 t.
The overfishing level was determined from the Tier 3a formula, where an F35% value of 0.38 gives a 2001 OFL of 102,000 t. Model projections indicate that this stock is neither overfished nor approaching an overfished condition.
Other flatfish
Beginning with the 1995 fishing season, flathead sole were removed from the "other flatfish" complex, leaving Alaska plaice as the dominant member of the complex. The complex has remained at a stable, and presumably high, level of abundance throughout the modern history of the EBS survey time series (i.e., since 1982, when the present survey net configuration was adopted). The present assessment includes an update of catch and trawl survey information to the age-structured model used to estimate Alaska plaice abundance. The stock assessment model indicates that the Alaska plaice population biomass peaked in 1984 at 1.3 million t and has since declined an estimated 34% to 865,000 t in 2000 due to reduced levels of observed recruitment.
This year's EBS bottom trawl survey resulted in biomass estimates of 501,470 t for Alaska plaice and 80,000 t for the remaining species in the "other flatfish" complex. The other Aother flatfish@ are Dover sole (1%), rex sole (21%), longhead dab (17%), Sakhalin sole (<1%), starry flounder (58%), butter sole (2%) and English sole (<1%). This represents a decrease of 19% in Alaska plaice and an increase of 15% of Aother flatfish@ relative to last year's estimates. Last year, plaice increased and Aothers@ decreased.
Reliable estimates of B40% , F40% , and F35% exist for this stock complex, and therefore it qualifies for management under Tier 3 of the BSAI Groundfish FMP. The updated point estimates of B40% , F40% , and F35% from the present assessment are 111,000 t (Alaska plaice only), 0.29, and 0.36, respectively. Given that the projected 2001 spawning biomass (Alaska plaice only) of 217,000 t exceeds B40% , the ABC and OFL recommendations for 2001 were calculated under sub-tier Aa@ of Tier 3. Because 85% of the Aother flatfish@ category is Alaska plaice and the assessment author calculates plaice separately, the ABC and OFL for Alaska plaice were determined separately from the other species. For Alaska plaice, FABC was set at the F40% level (=0.29), which is the maximum allowable under Tier 3a. Projected harvesting at the F40% level gives a 2001 ABC of 122,000 t for Alaska plaice. For the remaining species in the flatfish complex, FABC was also set at the F40% level (=0.30), which is the maximum allowable under Tier 3a. Projected harvesting at the F40% level gives a 2001 ABC of 18,000 t for Aother@ non-plaice flatfish.
Greenland turbot
A stock assessment was not completed for Greenland turbot in 2000. The following is summary from last year. The 1999 EBS bottom trawl survey resulted in a biomass estimate of 19,797 t, a 30% decrease relative to the previous year's estimate. Conditions do not appear to have changed substantively over the past several years. For example, the abundance of Greenland turbot from the Eastern Bering Sea trawl survey has found only spotty quantities with very few small fish that were common in the late 1970s and early 1980s. The majority of the catch has shifted to longline gear in recent years. The assessment model analysis was similar to last year but with a slightly higher estimated overall abundance. This is attributed this to a slightly improved fit to the longline survey data trend. The target stock size (B40% , female spawning biomass) is estimated at about 81,200 t while the projected year 2000 spawning biomass is about 150,800 t. Given the continued downward abundance trend and no sign of recruitment to the shelf are, it is recommended that the ABC be set to 25% of the maximum FABC value.
Last year, the SSC determined that reliable estimates of B40%, F40%, and F30% existed for this stock, and that this stock therefore qualified for management under Tier 3 of the BSAI Groundfish FMP. The updated point estimates of B40%, F40%, and F35% (which replaces F30% under Amendment 56) from the present assessment are 81,300 t, 0.26, and 0.32, respectively. Projected spawning biomass for 2000 is above B40% , placing Greenland turbot in sub-tier Aa@ of Tier 3. The ratio of 1999 spawning biomass to B40% has changed dramatically since last year=s assessment: In last year=s assessment, the ratio was 79%, whereas in the present assessment, the ratio is 203%. The main reason for this change is that the recruitments used to estimate B40% in last year=s assessment included year classes spawned prior to the regime shift of 1977, whereas the recruitments used to estimate B40% in the present assessment include only year classes spawned during the current environmental regime. The maximum permissible value of FABC under Tier 3a is 0.26. A fishing mortality rate of 0.26 translates into a 2000 catch of 34,700 t, which would be the maximum permissible ABC under Amendment 56. The Plan Team concurred with the authors= recommendation to set the 2000 ABC at a value substantially less than the maximum permissible, using FABC = 0.25 ´ max FABC, which results in a 2000 ABC of 9,300 t. A 2000 ABC well below the maximum permissible value is warranted for the following reasons: 1) estimated age 1+ biomass has trended downward continually since 1972; 2) the 7 most recent age 1 recruitments constitute 7 of the lowest 8 values in the entire time series; and 3) if the maximum permissible ABC of 34,700 t were actually caught, this would constitute the highest catch since 1983, even though spawning biomass in 2000 is projected to be less than half of what it was in 1983.
The OFL fishing mortality rate is computed under Tier 3a, FOFL = F35% = 0.32, and translates into a 2000 OFL of 42,000 t. Model projections indicate that this stock is neither overfished nor approaching an overfished condition.
Arrowtooth flounder
The arrowtooth flounder stock assessment utilizes a length-based stock assessment model and is updated for the 2000 assessment with the incorporation of new catch and survey information. This year's EBS bottom trawl survey resulted in a biomass estimate of 340,000 t, a 29% increase relative to last year's estimate and similar to the 1998 trawl survey. The 2000 AI trawl survey resulted in a biomass estimate of 93,500 t, which represents 22% of the BS/AI arrowtooth flounder combined biomass estimate from the trawl surveys. Model results indicate that the population total biomass peaked in 1994 at 914,00 t and has since declined 18% to 750,000 t in 2000. Recruitment since 1992 is estimated to be below the long-term average.
Reliable estimates of B40%, F40%, and F35% exist for this stock, therefore qualifies for management under Tier 3 of the BSAI Groundfish FMP. The updated point estimates of B40%, F40%, and F35% from the present assessment are 183,000 t, 0.23 and 0.28, respectively. Given that the projected 2001 spawning biomass of 458,000 t exceeds B40%, the ABC and OFL recommendations for 2001 were calculated under sub-tier Aa@ of Tier 3. FABC was set at the F40% (=0.23) level, which is the maximum permissible level under Tier 3a. Projected harvesting at the F40% level gives a 2000 ABC of 117,000 t.
The OFL fishing mortality rate is computed under Tier 3a, FOFL = F35% = 0.29, and translates into a 2000 OFL of 141,500 t. Model projections indicate that this stock is neither overfished nor approaching an overfished condition.
The effort in the fishery increased this year due to a developing market in Japan for arrowtooth flounder, though still a low exploitation rate (< 0.02).
For further information, contact Thomas Wilderbuer (206) 526-4224.
GULF OF ALASKA
Arrowtooth flounder
EXPLOITABLE
|
YEAR |
ABC |
BIOMASS |
CATCH1 |
|
1999 |
217,110 |
2,126,714 |
16,062 |
|
2000 |
145,360 |
1,571,670 |
24,056 |
|
2001 |
148,150 |
1,586,530 |
|
1/ Catch through October 28, 2000.
The 2001 exploitable biomass of 1,586,530 mt is based on abundance estimates derived from an age-structured model developed with AD Model Builder software. Similar to the previous assessment, the model accommodated a higher proportion of females in the larger size intervals of both survey and fishery data by giving males a higher mortality rate than females. Exploitable biomass in 2001 is estimated to be greater than B40% and ABC was determined to be 148,150 mt based on Tier 3a calculations (F40% = 0.134). The ABC was apportioned among regulatory areas in proportion to biomass distributions in the 1999 trawl survey. The resulting ABCs are:
|
WESTERN |
CENTRAL |
WYAK |
EYAK/SEO |
TOTAL |
|
16,480 |
99,590 |
24,220 |
7,860 |
148,150 |
Using Tier 3a criteria, the overfishing level based on F35% = 0.159 is estimated at 173,550 mt.
For further information, contact Jack Turnock (206) 526-6549.
10. Walleye pollock
a. Research
BERING SEA
Acoustic/Trawl Surveys - Southeastern Bering Sea Shelf and Bogoslof Island Area
The Mace Program completed EIT surveys of walleye pollock on the southeastern Bering Sea shelf and in the Aleutian Basin near Bogoslof Island aboard the NOAA ship Miller Freeman between February 27 and March 13, 2000. Survey design consisted of two series of parallel transects. On the Bering Sea shelf, east-west transects were spaced 12.5 nmi apart, and in the Bogoslof Island area, 10, 5, or 2.5 nmi-spaced transects (depending on fish density) were oriented north-south. The Bogoslof survey began in the east at about 166° W and proceeded westward to about 170° 15 W, covering 2000 nmi of trackline. On the southeastern Bering Sea shelf, pollock were observed from near the start of the first transect to near the end of the eighth. On the first several transects, pollock formed dense, near-bottom, aggregations between 95-100 m bottom depths that often extended for several miles. Dense pollock schools were found adjacent to Unimak Island beginning at about 50 m bottom depth; some continued westward to >150 m bottom depths. Fork lengths (FL) of pollock from 8 trawl hauls ranged between 30 and 73 cm and averaged 44 cm. Smaller pollock were encountered in the final shelf-area trawl haul that targeted isolated, dense, schools over bottom depths of around 160 m. Most males and females were pre-spawning (74% and 48%, respectively), although 43% of the females had small ovaries and were categorized as developing. Preliminary analyses estimate pollock biomass in this portion of the Bering Sea shelf to be about 0.816 million metric tons.
In the Bogoslof Island area, pollock were observed in the first two miles of the first transect in relatively shallow water. Farther to the west, pollock aggregations were sparse. Very few pollock were observed between transects 168-169° W. Much of the remainder of the cruise was spent surveying and trawling between 169-170° W, north of Samalga Pass, and east of the Islands of Four Mountains, where relatively large pollock spawning aggregations were observed. Pollock fork lengths ranged from 31-68 cm. On average, fish were largest in the Samalga Pass area. Percent female ranged from 35-79, with more females caught overall. The vast majority of fish were prespawning (95% and 94% among males and females, respectively). Average GSI among prespawning females was 0.17, similar to previous years= average Bogoslof GSIs. Numbers and biomass for the Bogoslof area in 2000 appeared to be somewhat lower than observed in 1998 and 1999. Preliminary analyses estimate pollock biomass in the Bogoslof area to be 0.321 million metric tons.
Acoustic/Trawl Surveys - Eastern Bering Sea Shelf
Between June 8 and August 3, 2000,the MACE program conducted an EIT survey of walleye pollock aboard the NOAA ship Miller Freeman on the eastern Bering Sea shelf from Port Moller, Alaska, to the U.S./Russia convention line. Principal objectives of the research cruise were 1) to collect echo integration and trawl data to estimate pollock abundance and distribution and 2) to collect pollock target strength information to validate the relationship between pollock length and target strength B a measure of acoustic reflectivity. Survey design comprised north-south transects spaced 20 nmi apart. Acoustic data were collected continuously between sunrise and sunset; pollock target strength data and Methot trawl samples for age-0 pollock were collected at night.
Preliminary cruise results show that pollock were present on all but the second transect of the survey. East of the Pribilof Islands, the highest pollock concentrations were observed along transects north of Unimak Island. Pollock abundance was lower between Unimak and the Pribilofs. West of the Pribilof Islands, pollock increased and peaked in abundance in an area southwest of St. Matthew Island. In the far west, pollock were heavily concentrated in a few spots along the U.S./ Russia border. On many transects pollock were distributed somewhat farther north in summer 2000 than in 1999, particularly west of the Pribilofs. Biological data and specimens were collected from 115 midwater, 9 bottom, 4 Marinovich, and 47 Methot trawls. Among pollock sampled in midwater and bottom trawls, lengths ranged from 10 cm to 82 cm. East of 170° W, pollock modal length was 44 cm; west of 170° W, pollock modal lengths were 12, 21, and 33 cm. The majority of pollock (51% of sexes combined) were observed to be in a developing maturity stage, with fewer numbers of post-spawners (28%) and immatures (20%). Estimated pollock abundance for the total survey area between the surface and 3 m off-bottom was 3.05 million tons and 7.6 billion fish. About 13% (0.39 million t) was in Steller sea lion critical habitat (CH) management area, 16% (0.50 million t) was east of 170° outside CH, and 71% (2.16 million t) was west of 170° W.
One of several additional research projects conducted during the cruise involved mounting an underwater video camera on the midwater trawl to observe pollock behavior in front of the codend as part of ongoing research on fish behavior in relation to trawl gear.
Acoustic/Trawl Surveys - Shelikof Strait
The Mace Program completed an EIT survey of walleye pollock within the Shelikof Strait area between Chirikof Island and Cape Chiniak between March 15 and March 28, 2000 aboard the NOAA ship Miller Freeman. Two survey passes were conducted in the Shelikof Strait area. For the first pass, parallel transects were spaced 13.9 km apart except on the western side of Shelikof Strait, where transect spacing was reduced to 6.9 km. All transects were spaced 6.9 km apart for the second pass. Most of the mature pollock were distributed along the western side of the Strait, with the greatest densities occurring from Cape Kekurnoi to Cape Nuskhak; a similar pattern of distribution has been observed in previous years. Echo sign was less dense but more broadly distributed along transect lines from Chirikof Island to Cape Kekurnoi. Fish were most abundant within 50-150 m of the bottom. The size distributions of pollock from hauls within the Strait generally exhibited dominant modes around 10-14 cm, 20-24 cm, 30-36 cm, and 43-57 cm FL. Seventy percent of the females greater than 34 cm FL were mature, with 67% in a pre-spawning condition, 1% spawning, and 2% spent. The mean GSI of 0.14 obtained from pre-spawning females was lower than the mean GSI of 0.18, 0.19, and 0.17 obtained during the 1996-98 surveys, respectively. Pollock from the 1999 year class (mode 10-14 cm FL) formed a strong, well-defined midwater layer (150-200 m depth) from about Chirikof Island to Sitkinak Strait and off Cape Kekurnoi. Video recordings of pollock behavior within the midwater trawl were collected during the Shelikof Strait survey and will be used to evaluate sampling gear performance.
Feasibility Study for Future Fishery-Pollock-Steller Sea Lion Investigation
A feasibility study was conducted off the eastside of Kodiak Island between August 8 and August 20, 2000 aboard the NOAA ship Miller Freeman as a collaborative effort between RACE and REFM scientists from the AFSC. The purpose of the work was to evaluate the suitability of this location for conducting a multi-year summertime field experiment to evaluate the effect of commercial fishing activity on the availability of walleye pollock to Steller sea lions (Eumetopias jubatus).
Principal objectives for the feasibility study were to: 1) use standard EIT survey methodologies to describe the abundance and distribution patterns of walleye pollock within Barnabas and Chiniak gullies; 2) determine whether acoustic back-scattering from non-targeted species would prohibit meeting the 1st objective; and 3) determine the spatio-temporal variability in pollock abundance and distribution patterns within and between the two gullies over the duration of the study. The researchers plan to use this information to assess the proposed experimental design for the more comprehensive field work which will occur in subsequent years and which requires that the gullies serve as treatment and control sites where commercial fishing would be allowed in one location and prohibited in another.
The EIT survey operations included the collection of 38- and 120-kHz acoustic data, as well as net catch data from 38 midwater and 7 bottom trawls. These data were collected along a series of uniformly-spaced (i.e., 3 nmi) parallel transects during the 2-week survey. Two complete survey passes were conducted in both Barnabas and Chiniak gullies.
Preliminary survey results indicated that it was possible to use EIT survey methods to assess the summer distribution of pollock within the study area. Substantial back-scattering was attributed to Aadult@ pollock as well as Asmall fishes@ which included age-0 pollock, age-1 pollock, and capelin (Mallotus villosus). It was difficult, however, to determine the relative contribution of capelin and age-0 pollock to the Asmall fishes@ backscattering. Additional analyses of the data are in progress to quantify the spatio-temporal distribution patterns and abundance of pollock and capelin. Interpretation of these results will provide information to determine whether these two submarine gullies off of the east side of Kodiak Island are appropriate sites for conducting a more comprehensive field experiment during the next summer.
For more information, please contact Dr. William Karp, (206) 526-4164.
b. Stock assessments
GULF OF ALASKA
The age-structured assessment model and three population biomass surveys indicate that the Gulf of Alaska pollock stock has declined from the high levels observed in the early 1980s to the lowest level estimated since 1969. Poor recruitment for the four consecutive year-classes 1990-93 and then again in 1996 and 1997 have caused the stock decline. Total 2+ biomass is estimated at 706,000 t in 2000 and the projected exploitable biomass for age-3+ pollock in 2001 is 699,000 mt. Projected spawning biomass in 2001 for the Western, Central and West Yakutat areas is 202,800 mt, which is below the B40% value of 247,000 mt and places Gulf pollock in Tier 3b. In addition, the stock is projected to decline further in 2002. The assessment author recommended the 2001 ABC set at 99,350 mt for the Western, Central, and West Yakutat areas. This harvest rate corresponds to an F40% adjusted = 0.28. As in the previous assessment, the guideline harvest level (1,420 mt) for the state-managed pollock fishery in Prince William Sound (PWS) was deducted from the GOA ABC prior to area apportionment of the 2001 GOA ABC.
The 2001 ABC is apportioned according to the mean distribution of the exploitable population biomass in the four most recent bottom trawl surveys. Using just the 1999 trawl survey distributions was not selected because of high variability observed in the 1999 trawl survey distributions. This resulted in the apportionments listed below. In the Western and Central areas, the ABC is further apportioned among four reporting areas in the A and B seasons and among three reporting areas in the C and D seasons. The West Yakutat ABC is not seasonally apportioned. OFL for Western, Central, and West Yakutat pollock in 2001 is defined as F35%adjusted = 117,750 mt.
Pollock in the Southeast Outside and East Yakutat areas fall into a Tier 5 assessment. Under this approach, 2001 ABC is 6,460 mt, based on exploitable biomass of 28,710 mt as derived from CPUE data during the 1999 Gulf trawl survey and a natural mortality estimate of 0.30. The OFL is 8,610 mt. The assessment authors noted that pollock catch in the pooled Southeast Outside and East Yakutat areas never exceeded 100 mt during 1991-2000.
Area Apportionment of Western, Central, and West Yakutat ABC
|
Area |
Shumagin |
Chirikof |
Kodiak |
Shelikof |
West Yakutat |
SE |
Total |
|
ABC (mt) |
35,240 |
14,260 |
26,650 |
20,680 |
2,520 |
6,460 |
105,810 |
For more information contact Dr. Martin Dorn 526-6548.
EASTERN BERING SEA
The recent stock assessment for the 2001 fishing season features new data from the 2000 fishery and bottom trawl and echo-integration trawl surveys. The 2000 bottom trawl survey biomass estimate of 5,140,000 t is an increase of 44% relative to the 1999 estimate and follows a 61% increase from 1998 to 1999. The 2000 echo-integration trawl survey estimated a biomass of 3,005,000 t, a decrease of 7% relative to the 1999 estimate and following an increase of 27% from the 1997 estimate, the last year an echo-integration trawl survey was conducted in this region. Ten alternative models were examined in the assessment, all of which follow the statistical age-structured approach that was used to set the 2000 ABC. All but one of these ten models estimate 2000 age 3+ biomass to fall between 10,200,000 t and 11,200,000 t (the other model gives a value of 6,900,000 t).
Of the ten models presented, Model 1 was chosen as the model of choice on which to base the 2001 ABC recommendation. The model assumes a Ricker stock-recruitment relationship and uses the commercial fishery selectivity pattern from 1999 to make projections of future catch and stock size. This model is most similar to the model used last year to recommend the 2000 ABC, except that the selectivity estimates are based only on estimates from 1999 since the establishment of cooperatives and new regulations may be best reflected in the most recent year of fishery data. In addition this year=s model runs all include the fishery CPUE data from 1965-1976.
The predicted strength of the 1996 year class is larger than observed for the 2000 bottom trawl and EIT surveys. This discrepancy likely is due to the model fit to the substantial increase in trawl survey biomass estimate by increasing the strength of the 1996 year class, inconsistent with the time-series of age composition information. Some contradiction apparently exists between the observed biomass estimate and the observed age compositions. However this inconsistency does not appear to lead to substantial bias in the abundance estimates.
Abundance estimates from 1993 to 1999 increased sharply in this year=s assessment. For example the estimate of 1999 age 3+ biomass is 7,513,000 t for last year=s assessment and 10,772,000 t for this year=s assessment, a 43% increase. The change in estimated abundance is the main reason the Tier 3b recommendation for 2001 is substantially larger than the Tier 3b recommendation for 2000. The change in estimated abundance appears reasonable. From 1998-1999 survey biomass increased 61% and from 1999-2000 increased 44%. The model provided a poor fit to the increased abundance estimates from 1998-1999 in previous assessments, but after two year=s of consecutive increases, the model provides a good fit to the increasing trend.
Last year, the SSC determined that reliable estimates of BMSY and the probability density function for FMSY exist for this stock, and that EBS walleye pollock therefore qualified for management under Tier 1. The senior assessment author continues to feel that the Tier 1 reference points are reliably estimated given the structure of the model. The updated estimates of BMSY and the harmonic and arithmetic means for FMSY from the present assessment are 2,125,000 t, 0.71, and 1.18, respectively, compared to 1,790,000 t, 0.50, and 0.80, respectively, from last year=s assessment. Projected spawning biomass for 2001 is 2,761,000 t (at time of spawning, fishing at FMSY), placing EBS walleye pollock in sub-tier Aa@ of Tier 1. The maximum permissible value of FMSY under Tier 1a is 0.71, the harmonic mean of the probability density function for FMSY. A fishing mortality rate of 0.71 translates into a 2001 catch of 2,125,000 t, which would be the maximum permissible ABC under Tier 1a (compared to 1,200,000 t in last year=s assessment). Last year the senior assessment author recommended setting ABC at a lower value, specifically, the maximum permissible level that would be allowed under Tier 3. The Tier 3 reference points B40% and F40% are estimated at values of 2,426,000 t and 0.49, respectively, similar to 2,340,000 t and 0.48 from last year=s assessment. The projected spawning biomass for 2001, 3,066,000 t (at time of spawning, fishing at F40%), is above B40%, so the maximum permissible value of FABC that would be allowed under Tier 3 is not adjusted downward. The 2001 catch associated with a fishing mortality rate of 0.49 is 1,842,000 t, a 13% reduction from the maximum permissible level under Tier 1.
The ABC recommendation for 2001 is 1,842,000 t. Although this ABC is a 62% increase from the 1,139,000 t ABC approved for 2000, the increase was recommended for the following reasons:
1) The model to estimate abundance and the method to recommend 2001 ABC are the same as those used for the 1999 and 2000 ABC values.
2) Abundance has substantially increased and so a substantial increase in ABC appears reasonable. A broad distribution of ages in the population are average strength or better, not only the strong 1996 year class. The catch will come from multiple year classes, not a single predominant year class as occurred for some harvests in the past. Spawning biomass is projected to stay above 35% of unfished biomass if harvesting in future years continues based on an F40% policy, except for a slight dip below B35% in 2003. Even if biomass equals the lower confidence bound for abundance of 5,000,000 t, a 1,840,000 t catch would result in an exploitation rate of about 30%, which the senior assessment author says is considered a reasonable maximum exploitation rate for gadid stocks.
3) Increased pollock abundance potentially provides additional prey to pollock predators. Even with the increased ABC, additional pollock is likely to be available as prey compared to three years ago when pollock abundance was substantially less. In addition other measures are in place to provide pollock as prey to higher trophic levels.
The OFL fishing mortality rate under Tier 3a is approximately 0.80, corresponding to F35%. A fishing mortality rate of 0.80 translates into a 2001 OFL of 2,359,000 t. The EBS walleye pollock stock is not overfished nor approaching an overfished condition.
ALEUTIANS
The 2000 bottom trawl survey of the Aleutians Islands region resulted in a biomass estimate of 106,000 t, an increase of 13% relative to the 1997 estimate. The 1997 estimate previously was 106,000 t, but was revised this year to 94,000 t due to discrepancies found in strata definitions. The 1997 stock assessment concluded that the model which had been used to recommend ABC for 1997 was no longer reliable due to the confounding effect of immigration from other areas, and the SSC determined that Aleutian pollock qualified for management under Tier 5. The recommended 1998, 1999, and 2000 ABC was 23,800 t, computed as the product of the 1997 survey biomass estimate and 75% of the natural mortality rate (0.3). The recommended 1998, 1999, and 2000 OFL was 31,700 t, computed as the product of the 1997 survey biomass estimate and the natural mortality rate. The 2000 survey biomass estimate is considered the best available estimate of biomass in 2000, which keeps 2001 ABC and OFL at the 2000 levels. As a Tier 5 stock, it is not possible to determine whether Aleutian pollock is overfished or whether it is approaching an overfished condition.
BOGOSLOF
The 2000 hydroacoustic survey of the Bogoslof region resulted in a biomass estimate of 301,000 t. Last year Bogoslof pollock were placed in Tier 5. This designation places Bogoslof pollock in the same classification as Aleutian pollock, a stock which generally has about the same quality of assessment information. The 2001 recommendation of ABC and OFL are based on the hydroacoustic survey estimate for the entire spawning aggregation (301,000 t), rather than the biomass observed in Area 518 alone. Because the hydroacoustic survey is attempting to measure the biomass of a discrete spawning aggregation, it was deemed appropriate to use the entire biomass estimate rather than the proportion of the estimate that happened to reside in Area 518 at the precise time of the survey. In SAFE reports previous to last year, ABC calculations were made by projecting the hydroacoustic biomass estimate forward to account for natural mortality, but not growth or recruitment. In contrast, growth and recruitment have been assumed to balance natural mortality for all other BSAI stocks lacking an age- or length-structured assessment model. The Ground Plan Team recommended that the assumptions of zero growth and zero recruitment be discontinued for Bogoslof pollock, and recommended instead that projected biomass be set equal to the most recent survey biomass estimate. The recommendation for the maximum permissible 2001 ABC is 45,200 t (= 301,000 t ´ M ´ 0.75), and for 2001 OFL is 60,200 t (= 301,000 t ´ M). As a Tier 5 stock, it is not possible to determine whether Bogoslof pollock is overfished or whether it is approaching an overfished condition.
For further information contact Dr. James Ianelli, (206)526-6510.
13. Other Species - Atka mackerel
a. Research
Identification and Characterization of Atka Mackerel Reproductive Habitat
The basic biology of Atka mackerel has been poorly studied despite its commercial value and importance as a key forage species for the endangered Steller sea lion and other marine piscivores. After locating an Atka mackerel nesting site in the central Aleutian Islands in 1999, AFSC scientists returned there in July and August 2000 to investigate the spawning and associated habitat. The primary objective for last summer=s cruise was to estimate and more fully describe the spawning area near Finch Cove, Seguam Island. The F/V Morning Star served as a support platform for near shore dive and underwater camera work. Thirty four man dives and numerous drop camera sets were made in the near shore areas surrounding Seguam and Amlia islands. We obtained extensive video footage documenting the habitat in which Atka mackerel spawn, and recording the distinct behavior patterns associated with courtship, spawning, and nest guarding.
Three in situ time-lapse camera deployments, 34 man dives, and numerous drop camera sets were made in the nearshore areas surrounding Seguam and Amlia islands. On the last time-lapse deployment, the camera was aimed at a nest and a male was videotaped in the act of courtship and spawning with several different females. A current meter was placed alongside the time-lapse camera to see how nesting behavior varied with the tidal cycle. Current speeds ranged from 0 to 7.94 cm/s and water temperature 4.7 to 5.7°C over a 24 h period. During an earlier AFSC cruise in June 2000, another time-lapse camera deployment was made at Finch Cove, in the general vicinity where nests were observed the previous year, to determine when males moved nearshore for spawning. The camera was retrieved in early August and the video footage revealed that males did not utilize that particular area for nesting during the three-month period.
A drop video camera was used to survey coastal areas of Amlia and Seguam Islands for other nesting habitat and to delineate the nesting site boundaries at Finch Cove. A new nesting site was observed at East Cape on the north side of Amlia Island. The Finch Cove nesting site extended coastwise just south of the cove (where the first time-lapse camera was placed) to Wharf Point on the south side. The Finch Cove terminus of the nesting site appeared to be less exposed to tidal current, which may have made it less favorable. A pronounced southerly swell became noticeable at Wharf Point terminus and may have been what limited the southern extent of the nesting area. The shallowest nest observed was 14m and the deepest was 32 m. Neither nests or rocky habitat extended beyond the 32 m contour where the bottom changed to moderately sloping sand. To determine if nest density varied over depth, diver transects were done at three depth zones: 14-17 m, 18-25 m, and 26-32 m. Embryo masses were collected across all depths to determine developmental stages of embryos and to determine average batch size so that embryo density for the entire Finch Cove spawning site could be estimated.
For more information, contact Bob Lauth, (206)526-4121.
Research on AHabitat Areas of Particular Concern@
A survey of a potential Habitat Area of Particular Concern (HAPC) was carried out by ABL in late May 2000. A manned submersible was used to run transects at the site about 20 km W of Cape Ommaney, Baranof Is., southeastern Alaska during a series of 7 dives. The submersible was tracked at 1 min intervals from the support vessel using DGPS and an ultra-short baseline acoustic tracking system. Continuous images of the sea floor were obtained using an externally-mounted video camera fitted with a laser scaling device. The audio tracks on the videotapes were used to note time when the transects began and ended, water depth, estimated current velocity, substrate, megahabitat and microhabitat characteristics, lateral water visibility, faunal assemblages, behavior and associations of individual species within those assemblages, presence of derelict fishing gear along transects, and any damage to epifaunal invertebrates.
The potential HAPC site measures approximately 400 x 600 m with maximum vertical relief of 55 m, and water depths range between 201 and 256 m. The area studied is likely a ridge projecting southeastward from the 200 m isobath on the continental shelf, and may be part of a series of such features. The substrate is primarily bedrock and large boulders, most likely composed of mudstone, and provides abundant cover in the form of caves and interstices of various sizes. The epifaunal community is rich and diverse, much more so than the surrounding low-relief sand-gravel habitat. Largest epifauna were gorgonian red tree coral colonies and several species of sponge. These organisms were not randomly distributed at the study site. Numerous species of fish, particularly adult and sub-adult rockfish, were present in relatively large numbers and were often associated with gorgonian coral colonies and several species of sponge. Derelict longline gear was commonly observed, as were dead and damaged red tree coral colonies.
The submersible depth and location data were used to produce a precise bathymetric chart of the site by Nautical Solutions Inc., of Annapolis, MD. Data recorded in real time on the submersible system=s event log, as well as data recorded on the video and audio tapes, are being used in conjunction with computer software provided by Maptech, Inc., of Andover MA, to produce chart overlays depicting locations of particular habitat features and associated biota.
For more information, contact Linc Freese at (907) 789-6045.
Effects of Fishing on Sea Floor Habitat
Coral in Alaska: Distribution, Abundance, and Species Associations
To help identify fishery management actions that minimize the adverse impacts of fishing activities on corals in Alaska, scientists at ABL analyzed the distribution and abundance of corals based on trawl survey data in the AFSC RACEBASE database collected during 1975-1998. The species of groundfish associated with coral were also examined. Soft corals, primarily Gersemia sp., were the most frequently encountered corals in the Bering Sea. In the Aleutian Islands gorgonian corals, primarily in the genera Callogorgia, Primnoa, Paragorgia, Fanellia (=Callogorgia), Thouarella, and Arthrogorgia were the most common corals. In the Gulf of Alaska, gorgonian corals, primarily in the genera Callogorgia and Primnoa, and cup corals, primarily AScleractinia unidentified@, occurred most frequently. The Aleutian Islands area appears to have the highest abundance and diversity of corals. Some fish groups are associated with particular types of coral. Rockfish (Sebastes spp. and Sebastolobus alascanus) and Atka mackerel (Pleurogrammus monopterygius) were the most common fish captured with gorgonian, cup, and hydro corals, whereas flatfish and gadids were the most common fish captured with soft corals.
For more information, contact Jon Heifetz at (907) 789-6054.
Growth and Recruitment of an Alaskan Shallow-water Gorgonian
At least 20 species of gorgonian corals inhabit Alaskan waters. Specimens of all but one species have been incidentally entangled in fishing gear (e.g., hook and line, longlines, trawls, crab pots, and fish traps) and detached from the seafloor. Several species attain large size and provide habitat in the form of structure and refuge for species of demersal fish and invertebrates. The effects of coral habitat alteration on benthic communities are unknown, but may be substantial due to the reported longevity and slow growth rates of cold-water corals. The North Pacific Fishery Management Council is currently considering measures to establish several marine protected areas where gorgonian corals are abundant. In 1999-2000, scientists from the ABL began a study to examine growth and recruitment of Calcigorgia spiculifera, a shallow-water Alaskan gorgonian, in an effort to elucidate the effects of fishing activities on coral habitat.
Computer image analysis tools were used to measure the linear length of colony branches from digitized video images collected by scuba diving on tagged specimens. Length of a branch was measured along the medial axis from the point opposite its origin. This method provides a permanent record of colony morphometry. Highly accurate measurements are possible with proper colony orientation with respect to the calibration grid and parallel alignment of the camera lens with the grid.
Thirty five colonies were tagged at 2 sites in southeastern Alaska in July 1999. Thirty two (91%) of those colonies were found again when the sites were re-visited in July 2000. The three missing colonies had presumably detached from the seafloor. Growth measurements were possible for 16 colonies. Growth rate was variable for branches from the same colony and also between colonies. Mean branch growth rate at both sites ranged from -1.82 to 14.83 mm yr-1. Growth rates (mean = 5.81 mm yr-1, std = 4.99) measured during this study were generally much lower than those reported for other gorgonians worldwide, including Alaskan Primnoa, a deep-water species. Recruitment of new colonies had not occurred at either study site for a minimum of several years indicating that recruitment in this species, at least at our study sites, is a rare sporadic event.
The slow growth rates measured during the first year of this study, although preliminary, are noteworthy since shallow-water corals are widely believed to have faster growth rates and shorter life spans than deep-water corals. Additionally, recruitment appears to be a rare, sporadic event. Shallow-water gorgonian communities may therefore exhibit slow recovery rates from sea floor perturbations. Future research priorities are to focus on growth of smaller colonies and to establish a third study site where colonies are more numerous and more variable in size (i.e., age).
For more information, contact Robert Stone at (907) 789-6031.
Study of Alaskan Sponges
A recent study of the effects of mobile fishing gear on the benthos of the continental shelf in the eastern Gulf of Alaska has shown that several species of large erect sponge provide important components of structural habitat on the seafloor, and are particularly susceptible to removal or damage by commercial trawling activity. No sign of recovery from trawl damage was noted during a follow-up investigation conducted one year post-trawl. In contrast, experimental trawling carried out in warm, shallow water on the southeastern continental shelf of the U.S. has shown that sponge communities are quick to recover to pre-trawl abundances and that individual damaged sponges undergo rapid regeneration. Because the ability of benthic epifauna to recover from trawl damage may be a consideration in future Fishery Management Plans, ABL biologists will be conducting a study of several species of sponge in 2001. A small community of sponges was previously discovered at scuba diving depths in Seymour Canal, Admiralty Island, southeastern Alaska. Several of the species present resembled those found in deeper waters on the continental shelf in the Gulf of Alaska.
The purpose of this study is to determine some basic life history parameters of shallow cold water sponges. Growth and regeneration is of particular interest. During annual observations we hope to collect additional information regarding large scale distribution, habitat associations, and recruitment. Plans for 2001 are to visit the site in Seymour Canal to: 1) roughly chart the distribution of the sponge community; 2) tag individual sponges; 3) take manual measurements of individual sponges; 4) video individual sponges so the growth can be measured; and 5) remove pieces of a known size from individual sponges to examine regenerative ability and to determine species through spicule analysis. During the cruise several additional sites will be examined for the presence of additional sponge communities. During future years we hope to deploy temperature probes, current meters and settling substrates at the site(s).
For additional information contact Linc Freese at (907) 789-6045.
Development of a Benthic Sled to Observe Seafloor Habitat
Fishing impact studies by ABL have depended on videos of the seafloor to quantify invertebrates and habitat. A manned submersible has been the primary method of collecting seafloor videos. As a method of supplementing video collected via submersible, a benthic sled was developed and tested in 1999 by ABL with assistance of the AFSC RACE Division. The sled was constructed and tested in waters near Kodiak using video equipment that was developed for attachment to bottom-trawls. The sled was tested at speeds of 1-3 knots and it traveled smoothly on the seafloor and produced video of the seafloor.
In 2000, ABL and RACE developed a system that allows video to be collected at a sled speed of 2-4 knots and then replayed at slower video speeds without a significant reduction in resolution. In April 2000, the new digital camera system was installed on the sled and tested aboard the NOAA research vessel John N. Cobb. During this cruise a variety of camera settings and lighting options were tested. The system was tested to 650 feet and survived encounters with boulders and crab pots. Results indicate that this relatively inexpensive system can be successfully used to observe and enumerate small benthic fauna and may be useful in future
studies of fishing gear impacts on the benthic habitat.
For additional information, contact Phil Rigby at (907) 789-6653.
Studies on Sea Lion/Groundfish Interactions:
Seasonality of Prey Availability in Regions of Contrasting Steller Sea Lion Abundance Trends
The Auke Bay Laboratory began research in 2001 to test the hypothesis that sea lion prey diversity and seasonality are related to Steller sea lion population trends. The decline in the western population of Steller sea lions may be due to decreased prey availability; this decrease may be exacerbated by fishery removals of prey in sea lion habitat. Area-specific diet diversity and population change of Steller sea lions also appear to be related, with faster declines in areas of lower diet diversity (Merrick et al. 1997). Steller sea lions also may switch diet seasonally, as different prey become more available. The purpose of this set of studies is to test the hypothesis that sea lion prey diversity and seasonality are related to Steller sea lion population trends. The approach is to measure Steller sea lion prey, prey quality (free fatty acid analysis), and predator abundance and fishery removals near selected rookeries and haul outs, emphasizing seasonal measurements conducted during critical life stages of Steller sea lions. Two regional trend areas, Southeast (SE) Alaska and the Kodiak area, are being compared. Study haul outs and rookeries were selected based on year-round accessibility; simultaneous sampling of sea lion abundance, distribution, and diet (scats) is occurring by other cooperating agencies. The University of Alaska currently is conducting a seasonal study on Kodiak Island, an area where Steller sea lion abundance is declining. The ABL is studying sites in SE Alaska, where Steller sea lion abundance has been stable. In SE Alaska, the ABL is cooperating with the Alaska Department of Fish and Game, the University of Alaska, and the North Pacific Universities Marine Mammal Research Consortium. This study also is being coordinated with the existing University of Alaska study on Kodiak Island. Field work for the SE Alaska study began in March 2001.
For more information, contact Michael Sigler at 907-789-6037.
Shark Predation of Steller Sea Lions
The Auke Bay Laboratory plans to expand research to test the hypothesis that sleeper sharks prey on Steller sea lions. Longlines will be used to capture sleeper sharks around Steller sea lion rookeries in the central Gulf of Alaska during times of pup vulnerability to determine if live Steller sea lions are prey for sleeper sharks. The diet of sleeper sharks will be investigated by collecting stomach content data (including microsatellite DNA-based identification of questionable prey items) and by fatty acid analysis of tissue samples. Also, the vertical distribution of sharks will be measured by tagging methods for comparison to the vertical distribution of Steller sea lions while at sea. Currently, 3 sleeper sharks are tagged with satellite pop-up tags (tagged in 2000 as part of an Exxon Valdez Oil Spill study), and tagging 9 additional sleeper sharks would strengthen the biological information on depth, activity, and movements. Field work is planned for August 2001 and March 2002.
For more information, contact Michael Sigler at 907-789-6037.
Survey Gear Performance Research
Retrospective Evaluation of Bottom Trawl Survey Information
RACE Groundfish scientists have been continuing a retrospective analysis of suspiciously small or Azero@ catches in our West Coast triennial bottom trawl surveys (1977-1998), especially in the early survey years of 1977, 1980, and 1983. Although there is no definitive proof, we suspect that many of these hauls were partly or entirely off-bottom, greatly reducing the catch rates of some important fish and invertebrates species. Supporting this theory is a strong trend in the data showing that the catch rates of benthic species have been increasing throughout the survey history. If an arbitrary threshold is imposed on the data, so that hauls with total CPUE values below 1.0 kg/ha (equivalent to about 4 kg total catch in a standard haul) are removed from the data set, biomass estimates increase substantially for several species of flatfish, especially in 1980. Numerous changes in our trawling methodology, including increased use of electronic trawl monitoring devices, have improved our ability to keep the trawl on-bottom in the more recent surveys.
For more information, contact Mark Zimmermann, (206)526-4119.
GIS Resources
The principal GIS software products used at the Alaska Fisheries Science Center (AFSC) are ArcInfo and ArcView. A GIS coordinator acquires and maintains base data, provides consulting and technical support to users, and educates users on GIS technology. Most fisheries data is maintained in separate relational databases. GIS data includes coastlines, bathymetry, zones (e.g., by catch, EEZ, critical habitat), biological data (e.g., marine sightings), and physical data such as ice, temperature, and currents. GIS is used to produce an atlas of ichthyoplankton, define critical habitat, plan research cruises, analyze results of animal movement, make maps for journal articles, create bathymetry from soundings, and show the distribution and quantity of fish. GIS is used because "A picture is worth a thousand words", GIS saves time, and some things can only be done with a GIS.
In addition to establishing core GIS data, institutional framework and GIS educational opportunities are being developed. Metadata is being developed so users have a better idea of the accuracy of the data and its appropriate use. Metadata also informs users of what data needs citations, and how to cite the data. A fall weekly GIS seminar was presented and recorded. These recordings were placed into RealPlayer format and made available to users for viewing. A GIS users group meets every other month. At the last meeting a technical representative from ESRI presented highlights from the new software release and showed users some tricks and tips to using the current software.
|
APPENDIX II.--RESOURCE ECOLOGY AND FISHERIES MANAGEMENT DIVISION |
|||||||
|
Richard Marasco -- Director |
|||||||
|
Loh Lee Low -- Deputy Director |
|||||||
|
North Pacific Groundfish Observer Program |
Age Determination Unit |
Status of Stocks and Multispecies Modeling |
Resource Ecology and Ecosystems Modeling |
Socio-Economic Assessment |
|||
|
Ito, Daniel -- Supervisor |
Kimura, Daniel -- Supervisor |
Hollowed, Anne -- Supervisor |
Livingston, Patricia -- Supervisor |
Terry, Joe -- Leader |
|||
|
Barbeaux, Steven |
Anderl, Delsa |
Bailey, Michael |
Buckley, Troy |
Felthoven, Ron |
|||
|
Barns, Alison |
Blaisdell, Mark |
Dorn, Martin |
Derrah, Christopher |
Hiatt, Terry |
|||
|
Berger, Jerry |
Gburski, Christopher |
Fritz, Lowell |
Goiney, Bernard |
Lee, Todd |
|||
|
Campbell, Glenn |
Goetz, Betty |
Gaichas, Sarah |
Lang, Geoffrey |
||||
|
Corcoran, Andrew |
Hutchinson, Charles |
Ianelli, James |
Yang, Mei-Sun |
||||
|
Corey, Sheryl |
Johnston, Chris |
Ingraham, James |
|||||
|
Dakan, John |
Kastelle, Craig |
Lowe, Sandra |
|||||
|
Davis, Sharon |
Price, Tim |
Munro, Peter |
|||||
|
Decker, Daniel |
Roberson, Nancy |
Pearce, July |
|||||
|
DeMorett, Kim |
Shockley, Wes |
Spencer, Paul |
|||||
|
Dixon, Brian |
Short, Jonathan |
Thompson, Grant |
|||||
|
Dunn, Ed |
Turnock, Jack |
||||||
|
Ferdinand, Jennifer |
Wennberg, Sherrie |
||||||
|
Fitzgerald, Shannon |
Wilderbuer, Thomas |
||||||
|
Hewitt, Robert |
|||||||
|
Kenney, Heather |
|||||||
|
Kruse, Kenneth |
|||||||
|
Limpinsel, Douglas |
|||||||
|
Loefflad, Martin |
|||||||
|
Loomis, Todd |
|||||||
|
Maier, Robert |
|||||||
|
Mandina, Stephanie |
|||||||
|
Martin, Troy |
|||||||
|
McCauley, Kathleen |
|||||||
|
Middleton, Angela |
|||||||
|
Moser, John |
|||||||
|
Narita, Ren |
Observer Program (continued) |
||||||
|
Neidetcher, Sandra |
Teig, Karen |
||||||
|
Nordeen, Carrie |
Thompson, Lisa |
||||||
|
Reeves, Brenda |
Vijgen, Alison |
||||||
|
Ridley, Patricia |
Watson, Jennifer |
||||||
|
Risse, Peter |
Weikart, Heather |
||||||
|
Seither, Russ |
|||||||
|
Swanson, Rob |
|||||||
APPENDIX III -
Auke Bay Laboratory Groundfish Assessment Program Staff|
Name |
Duties |
|
Phil Rigby |
Program Manager |
|
Dave Clausen |
Rockfish, Gulf of Alaska Groundfish |
|
Dean Courtney |
Rockfish, Stock Assessment, Sablefish Daily Growth |
|
Linc Freese |
Effects of Fishing, Sponge Life History |
|
Jeff Fujioka |
Sablefish, Rockfish, Stock Assessment, Effects of Fishing |
|
Jon Heifetz |
Rockfish, Sablefish, Stock Assessment, Effects of Fishing |
|
John Karinen |
Gulf of Alaska Groundfish |
|
Mitch Lorenz |
Essential Fish Habitat |
|
Chris Lunsford |
Rockfish, Sablefish, Stock Assessment, Longline Survey |
|
Patrick Malecha |
Effects of Fishing |
|
Nancy Maloney |
Sablefish Tag Database, Longline Survey, and Seamounts |
|
Tom Rutecki |
Sablefish, Webmaster |
|
Mike Sigler |
Sablefish, Stock Assessment, Sea Lion Prey/Predation |
|
Robert Stone |
Effects of Fishing, Coral Life History |
|
Other ABL Staff Working on Groundfish |
|
|
Scott Johnson |
Essential Fish Habitat |
|
Bruce Wing |
Groundfish Early Life History |