DESCRIPTIONS OF DATA SERIES


Prices & Living Conditions

Consumer Price Index:
All Urban Consumers
Overview
1998 Revision
Data Sources
All Urban Consumers
Seasonal Adjustment
All Items All Items, Anchorage AK
All Items, Los Angeles-Riverside-Orange County, CA
All Items, Portland-Salem, OR-WA
All Items, San Diego, CA
All Items, San Francisco-Oakland-San Jose, CA
All Items, Seattle-Tacoma-Bremerton, WA
All Items, Western Region
Energy Items Only Energy Items Only, Los Angeles-Riverside-Orange County, CA
Energy Items Only, San Francisco-Oakland-San Jose, CA
Energy Items Only, Seattle-Tacoma-Bremerton, WA
Energy Items Only, Western Region
Producer Price Indexes Overview of PPI's
Data Sources
Seasonal Adjustment
Commodities-based Fuel and related products and power
Industry-based Primary Products
Secondary Products
Groundfish Products
Corrugated and Solid Fiber Boxes
GDP Price Deflator Summary and Source Information
Interest Rates Moody's BAA Bond Rating Source Information
Marine Fuel Prices Alaska Ports Overview
Selected Ports
Fuel Docks
Data Collected
Date of Collection
Data Availability
Data File Structure and Variable Formats
West Coast Ports
Overview
Port Selection Method
Selected Ports
Fuel Docks
Date of Collection
Data Collected
Data Availability
Data File Structure and Variable Formats
California Ports
Oregon Ports
Washington Ports
Alaska, California, Oregon and Washington Ports (Combined File)

Labor and Wage Information

Employment Cost Index Overview
Full documentation Please note that this is a PDF file therefore you will need a viewer, such as Adobe Acrobat Reader to read this file. If you do not have such a viewer, click here to download Adobe Acrobat Reader.
Manufacturing Total Compensation
Wages and Salaries
Benefits
Average Wages for Fishers Covered Employment and Wages, ES-202 Overview
Program Description
Industry Definitions
Data Available
Data Update Schedule
Contacts/Resources
Alaska
California
Oregon
Washington


CPI Data Sources


All CPI data are from the US Department of Labor, Bureau of Labor Statistics. They are available at http://146.142.4.24/cgi-bin/srgate using the BLS Series ID provided in the description of the data series.

[CPI Data Sources]
[All Urban Consumers]
[Seasonal Adjustment]
[All Items]
[Periodicity of Data]
[BLS Resources on the Web]
[CPI Overview]
[BLS CPI Homepage]
[Download Data Page]
[Top of This Page]

All Urban Consumers


All CPI's available for download from the Fisheries Economics Data Program are based on all urban consumers.

CPI's based on Urban Wage Earners and Clerical Workers may be obtained at http://146.142.4.24/cgi-bin/srgate. To obtain a CPI based on urban wage earners and clerical workers, use the BLS Series ID for the item you want replacing the leading "CU" with "CW". For instance, the BLS Series ID for a CPI for urban wage earners and clerical workers in the Western Region would be CWUR0400SA0 (instead of the CPI for all urban consumers CUUR0400SA0.) For additional help, follow the Series ID Formats link.

[CPI Data Sources]
[All Urban Consumers]
[Seasonal Adjustment]
[All Items]
[Periodicity of Data]
[BLS Resources on the Web]
[CPI Overview]
[BLS CPI Homepage]
[Download Data Page]
[Top of This Page]

Seasonal Adjustment


All CPI's available for download from the Fisheries Economics Data Program are NOT seasonally adjusted.

Seasonally adjusted CPI's may be obtained at http://146.142.4.24/cgi-bin/srgate. To obtain a seasonally adjusted CPI, use the BLS Series ID for the item you want replacing the second "U" with an "S". For instance, the BLS Series ID for a seasonally adjusted CPI for all urban consumers in the Western Region would be CUSR0400SA0 (instead of the unadjusted CUUR0400SA0.) For additional help, follow the Series ID Formats link.

[CPI Data Sources]
[All Urban Consumers]
[Seasonal Adjustment]
[All Items]
[Periodicity of Data]
[BLS Resources on the Web]
[CPI Overview]
[BLS CPI Homepage]
[Download Data Page]
[Top of This Page]

All Items


CPI's are available for download based on All Items or based on Energy Items Only.

CPI's based on other subsets of items may be obtained at http://146.142.4.24/cgi-bin/srgate. To obtain a CPI based on another subset of items, use the BLS Series ID for the item you want replacing "A0" (or "A0E" for energy items only) at the end of the series with the item code you want. For additional help, follow the Series ID Formats link.

[CPI Data Sources]
[All Urban Consumers]
[Seasonal Adjustment]
[All Items]
[Periodicity of Data]
[BLS Resources on the Web]
[CPI Overview]
[BLS CPI Homepage]
[Download Data Page]
[Top of This Page]

Periodicity of Data


All CPI's on the Economics Data Program website are available annually and either monthly, bi-monthly, or semiannually. Both types of data (annual and (bi)monthly/semiannual) are stored within each downloadable file. Use the following selection procedures if you only wish to view one type of data.

(Bi)Monthly vs. Annual Data

  • Select period = M13 for annual data.
  • Select period <> M13 for (bi)monthly data.

Semi-Annual vs. Annual Data

  • Select period = S3 for annual data.
  • Select period <> S3 for semi-annual data.
[CPI Data Sources]
[All Urban Consumers]
[Seasonal Adjustment]
[All Items]
[Periodicity of Data]
[BLS Resources on the Web]
[CPI Overview]
[BLS CPI Homepage]
[Download Data Page]
[Top of This Page]

BLS Resources on the Web


You may find the following websites useful when using the CPI:

[CPI Data Sources]
[All Urban Consumers]
[Seasonal Adjustment]
[All Items]
[Periodicity of Data]
[BLS Resources on the Web]
[CPI Overview]
[BLS CPI Homepage]
[Download Data Page]
[Top of This Page]

All Items, Anchorage AK

BLS Series ID CUUSA427SA0


CPI based on all urban consumers (CU) [CPI Data Sources]
Not seasonally adjusted (U) [CPI Overview]
Available semi-annually (S) [BLS CPI Homepage]
For the metropolitan statistical area (MSA) of Anchorage, AK (A427) [Download Data Page]
Base period: 1982-84=100 (S) [Top of This Page]
All items (A0) [Periodicity of Data]


All Items, Los Angeles-Riverside-Orange County, CA

BLS Series ID CUURA421SA0


CPI based on all urban consumers (CU) [CPI Data Sources]
Not seasonally adjusted (U) [CPI Overview]
Available monthly (R) [BLS CPI Homepage]
For the Metropolitan statistical area (MSA) of Los Angeles-Riverside-Orange County, CA (A421) [Download Data Page]
Base period: 1982-84=100 (S) [Top of This Page]
All items (A0) [Periodicity of Data]


All Items, Portland-Salem, OR-WA

BLS Series ID CUUSA425SA0


CPI based on all urban consumers (CU) [CPI Data Sources]
Not seasonally adjusted (U) [CPI Overview]
Available semi-annually (S) [BLS CPI Homepage]
For the Metropolitan statistical area (MSA) of Portland-Salem, OR-WA (A425) [Download Data Page]
Base period: 1982-84=100 (S) [Top of This Page]
All items (A0) [Periodicity of Data]


All Items, San Diego, CA

BLS Series ID CUUSA424SA0


CPI based on all urban consumers (CU) [CPI Data Sources]
Not seasonally adjusted (U) [CPI overview]
Available semi-annually (S) [BLS CPI Homepage]
For the Metropolitan statistical area (MSA) of San Diego, CA(A424) [Download Data Page]
Base period: 1982-84=100 (S) [Top of This Page]
All items (A0) [Periodicity of Data]


All Items, Seattle-Tacoma-Bremerton, WA

BLS Series ID CUUSA424SA0


CPI based on all urban consumers (CU) [CPI Data Sources]
Not seasonally adjusted (U) [CPI Overview]
Available semi-annually (S) [BLS CPI Homepage]
For the Metropolitan statistical area (MSA) of Seattle-Tacoma-Bremerton, WA (A423) [Download Data Page]
Base period: 1982-84=100 (S) [Top of This Page]
All items (A0) [Periodicity of Data]


All Items, San Francisco-Oakland-San Jose, CA

BLS Series ID CUURA422SA0


CPI based on all urban consumers (CU) [CPI Data Sources]
Not seasonally adjusted (U) [CPI Overview]
Available monthly (R) [BLS CPI Homepage]
For the Metropolitan statistical area (MSA) of San Francisco-Oakland-San Jose, CA (A422) [Download Data Page]
Base period: 1982-84=100 (S) [Top of This Page]
All items (A0) [Periodicity of Data]


All Items, Western Region

BLS Series ID CUUR0400SA0


CPI based on all urban consumers (CU) [CPI Data Sources]
Not seasonally adjusted (U) [CPI Overview]
Available monthly (R) [BLS CPI Homepage]
For the BLS Western Region, including CA, OR, WA, AK, AZ, HI, ID, NV (0400) [Download Data Page]
Base period: 1982-84=100 (S) [Top of This Page]
All items (A0) [Periodicity of Data]


Energy Items Only


CPI's are available for download based on All Items or based on Energy Items Only.

CPI's based on other subsets of items may be obtained at http://146.142.4.24/cgi-bin/srgate. To obtain a CPI based on another subset of items, use the BLS Series ID for the item you want replacing "A0E" (or "A0" for all items) at the end of the series with the item code you want. For additional help, follow the Series ID Formats link.

[CPI Data Sources]
[All Urban Consumers]
[Seasonal Adjustment]
[All Items]
[Periodicity of Data]
[BLS Resources on the Web]
[CPI Overview]
[BLS CPI Homepage]
[Download Data Page]
[Top of This Page]

Energy Items Only, Los Angeles-Riverside-Orange County, CA

BLS Series ID CUURA421SA0E


CPI based on all urban consumers (CU) [CPI Data Sources]
Not seasonally adjusted (U) [CPI Overview]
Available monthly (R) [BLS CPI Homepage]
For the metropolitan statistical area (MSA) of Los Angeles-Riverside-Orange County, CA (A421) [Download Data Page]
Base period: 1982-84=100 (S) [Top of This Page]
Energy Items Only (A0E) [Periodicity of Data]


Energy Items Only, Seattle-Tacoma-Bremerton, WA

BLS Series ID CUUSA424SA0E


CPI based on all urban consumers (CU) [CPI Data Sources]
Not seasonally adjusted (U) [CPI Overview]
Available semi-annually (S) [BLS CPI Homepage]
For the metropolitan statistical area (MSA) of Seattle-Tacoma-Bremerton, WA (A423) [Download Data Page]
Base period: 1982-84=100 (S) [Top of This Page]
Energy Items Only (A0E) [Periodicity of Data]


Energy Items Only, San Francisco-Oakland-San Jose, CA

BLS Series ID CUURA422SA0E


CPI based on all urban consumers (CU) [CPI Data Sources]
Not seasonally adjusted (U) [CPI Overview]
Available monthly (R) [BLS CPI Homepage]
For the metropolitan statistical area (MSA) of San Francisco-Oakland-San Jose, CA (A422) [Download Data Page]
Base period: 1982-84=100 (S) [Top of This Page]
Energy Items Only (A0E) [Periodicity of Data]


Energy Items Only, Western Region

BLS Series ID CUUR0400SA0E


CPI based on all urban consumers (CU) [CPI Data Sources]
Not seasonally adjusted (U) [CPI Overview]
Available monthly (R) [BLS CPI Homepage]
For the BLS Western Region, including CA, OR, WA, AK, AZ, HI, ID, NV (0400) [Download Data Page]
Base period: 1982-84=100 (S) [Top of This Page]
Energy Items Only (A0E) [Periodicity of Data]


PPI Data Sources


All PPI data are from the US Department of Labor, Bureau of Labor Statistics. They are available at http://146.142.4.24/cgi-bin/srgate using the BLS Series ID provided in the description of the data series.

[PPI Data Sources]
[Seasonal Adjustment]
[Periodicity of Data]
[BLS Resources on the Web]
[Overview of PPI's]
[BLS PPI Homepage]
[Commodities-Based PPIs]
[Industry-Based PPIs]
[Industry-Based Stage-of-Process Classification]
[Download Data Page]
[Top of This Page]

Seasonal Adjustment


All PPI's available for download from the Fisheries Economics Data Program are NOT seasonally adjusted.

Seasonally adjusted PPI's may be obtained at http://146.142.4.24/cgi-bin/srgate. To obtain a seasonally adjusted CPI, use the BLS Series ID for the item you want replacing the"U" with an "S". For instance, the BLS Series ID for a seasonally adjusted Producer Price Index Revision for all commodities would be WPS00 (instead of WPU00). For additional help, follow the Series ID Formats link.

[PPI Data Sources]
[Seasonal Adjustment]
[Periodicity of Data]
[BLS Resources on the Web]
[Overview of PPI's]
[BLS PPI Homepage]
[Commodities-Based PPIs]
[Industry-Based PPIs]
[Industry-Based Stage-of-Process Classification]
[Download Data Page]
[Top of This Page]

Periodicity of Data


All PPI's on the Economics Data Program website are available annually and monthly. Both types of data (annual and monthly) are stored within each downloadable file. Use the following selection procedures if you only wish to view one type of data.

Monthly vs. Annual Data

  • Select period = M13 for annual data.
  • Select period <> M13 for (bi)monthly data.
[PPI Data Sources]
[Seasonal Adjustment]
[Periodicity of Data]
[BLS Resources on the Web]
[Overview of PPI's]
[BLS PPI Homepage]
[Commodities-Based PPIs]
[Industry-Based PPIs]
[Industry-Based Stage-of-Process Classification]
[Download Data Page]
[Top of This Page]

BLS Resources on the Web


You may find the following websites useful when using the PPI:
[PPI Data Sources]
[Seasonal Adjustment]
[Periodicity of Data]
[BLS Resources on the Web]
[Overview of PPI's]
[BLS PPI Homepage]
[Commodities-Based PPIs]
[Industry-Based PPIs]
[Industry-Based Stage-of-Process Classification]
[Download Data Page]
[Top of This Page]

Description of Commodities-Based PPIs


Commodities-based PPIs are organized by type of product and end use, rather than by industry type as the Industry-based PPIs are. Chapter 14 of the BLS Handbook of [PPI] Methods explains further:

Commodity classification. The commodity classification structure of the Producer Price Index organizes products by similarity of end use or material composition, regardless of whether these products are classified as primary or secondary in their industry of origin. This system is unique to the PPI and does not match any other standard coding structure such as the SIC or the United Nations Standard International Trade Classification. Historical continuity of index series, the needs of index users, and a variety of ad hoc factors were important in developing the PPI commodity classifications.

Fifteen major commodity groupings (2-digit level) make up the all commodities index. Of these, 2 major commodity groupings form the index for farm products and processed foods and feeds, while the other 13 are grouped into the industrial commodities price index. Each major commodity grouping includes (in descending order of aggregation) subgroups (3-digit), product classes (4-digit), subproduct classes (6-digit), and individual items (8-digit). The structure of the traditional commodity classification system thus follows a strict, consistent hierarchy.

[PPI Data Sources]
[Overview of PPI's]
[BLS PPI Homepage]
[Commodities-Based PPIs]
[Industry-Based PPIs]
[Industry-Based Stage-of-Process Classification]
[Download Data Page]
[Top of This Page]

Commodities: Fuel and related products and power

BLS Series ID WPU05


Producer Price Index Revision - Commodities (WP) [PPI Data Sources]

Not Seasonally Adjusted (U) [Overview of PPI's]

Fuels and related products and power (05) [BLS PPI Homepage]

All commodities within group (missing item code) [Commodities-Based PPIs]

Base period: 1982=100 [Industry-Based PPIs]

Data are available monthly. [Industry-Based Stage-of-Process Classification]

[Download Data Page]


Monthly vs. Annual Data
  • Select period=M13 for annual data.
  • Select period<>M13 for monthly data.

  • Industry-based PPI


    Industry-based PPIs are organized by type of industry, rather than by type of product and end use as the commodities-based PPIs are. Chapter 14 of the BLS Handbook of [PPI] Methods explains further:

    Industry classification. A Producer Price Index for an industry is a measure of changes in prices received for the industry's output sold outside the industry (that is, its net output). As previously stated, the SIC 4-digit industry code is the basis for the industry price index system. Price indexes have also been available since 1985 for many more highly aggregated industry series at the 3- and 2-digit levels, as well as for total mining industries and total manufacturing industries. Nearly every 4-digit industry price index is accompanied by detailed indexes representing price movements for the various products made in that industry. Code numbers for these indexes at the 5-digit (product class) and the 7-digit (individual product) levels often follow the product codes and titles established by the Bureau of the Census as extensions of the SIC structure. Sometimes, however, BLS assigns its own codes and titles.

    In general, there may be as many as three kinds of product price indexes for a given industry. Every industry has primary product indexes to show changes in prices received by establishments classified in the industry for products made primarily, but not necessarily exclusively, by that industry. The industry under which an establishment is classified is determined by those products accounting for the largest share of its total value of shipments. In addition, most industries have secondary product indexes to show changes in prices received by establishments classified in the industry for products chiefly made in some other industry. Finally, some industries may have miscellaneous receipts indexes to show price changes in other sources of revenue received by establishments within the industry.

    [PPI Data Sources]
    [Overview of PPI's]
    [BLS PPI Homepage]
    [Commodities-Based PPIs]
    [Industry-Based PPIs]
    [Industry-Based Stage-of-Process Classification]
    [Download Data Page]
    [Top of This Page]

    Industry-Based Stage-of-Process Classification


    Chapter 14 of the BLS Handbook of [PPI] Methods explains the stage-of-process classification system.

    Industry-based stage-of-process classification. The Bureau publishes industry-based stage-of-process indexes, with data beginning in June 1985. These industry-based SOP indexes combine industry price indexes with interindustry transaction data from the 1987 input/output tables of the U.S. Department of Commerce; the result is a rigorous price model of the industrial economy.

    The industry-based SOP system is grounded on SIC industries, which are allocated to processing stages based on their transaction relationships to each other. The traditional SOP system is grounded on commodities, which are allocated to processing stages based on their degree of fabrication and on the class of their ultimate buyer.

    Industry-based SOP data use net output and net input weights that exclude transactions internal to an SOP component and that limit measurement to include only those transactions which affect other SOP components. This practice systematically eliminates multiple counting of price change, a problem which affects some commodity-based SOP indexes, particularly within the Intermediate Goods category.

    Industry-based SOP indexes are arranged to facilitate economic analysis of the inflation transmission process by maximizing the amount of frontflows within the system, i.e., transactions from industries classified in an earlier stage of process to industries classified in a later stage. Backflows (i.e., transactions from a later stage of process to an earlier stage) introduce circularity into what is ideally a sequential system.

    There are four major output SOP indexes: (1) Crude processors; (2) primary processors; (3) semifinished processors; and (4) finished processors. There are also four major material input SOP indexes, with two major subindexes for final demand: (1) Material inputs to primary processors; (2) material inputs to semifinished processors; (3) material inputs to finished processors; and (4) material inputs to final demand, including separate indexes for material inputs to personal consumption and material inputs to capital investment.6

    [PPI Data Sources]
    [Overview of PPI's]
    [BLS PPI Homepage]
    [Commodities-Based PPIs]
    [Industry-Based PPIs]
    [Industry-Based Stage-of-Process Classification]
    [Download Data Page]
    [Top of This Page]

    Industry-based PPI: Prepared fresh or frozen fish and seafoods: Primary Products


    BLS Series ID PCU2092#P


    Producer Price Index Revision - Current Series (PC) [PPI Data Sources]


    Not Seasonally Adjusted (U) [Overview of PPI's]


    Prepared fresh or frozen fish and seafoods industry. (2092) [BLS PPI Homepage]


    Primary products only (#P) [Commodities-Based PPIs]


    Base period: Dec 1982=100 [Industry-Based PPIs]


    Data are available monthly and annually. [Industry-Based Stage-of-Process Classification]


    Fisheries Economics Data Program Data Last Updated: Feb 8, 2002

    [Download Data Page]


    Monthly vs. Annual Data
  • Select period=M13 for annual data.
  • Select period<>M13 for monthly data.
  • [Top of This Page]


    These data relate to SIC 2092 only.


  • Click here for a description of this industry.
  • Click here for a description of other fisheries-related industries.
  • Data for other industries may be obtained at http://146.142.4.24/cgi-bin/srgate by using another SIC in place of 2092 in the BLS Series ID. For additional help, follow the Series ID Formats link.


  • These data relate to primary products only.


    BLS says this will reflect the average change in price these producers receive for the fresh or frozen fish or seafood that they make and sell.

  • Click here for more information on stage of process classification.
  • Data for secondary products and groundfish products are also available at this website.
  • Data for other products may be obtained at http://146.142.4.24/cgi-bin/srgate by using another product code in place of "#P" in the BLS Series ID. For additional help, follow the Series ID Formats link.


  • Industry-based PPI: Prepared fresh or frozen fish and seafoods: Secondary Products


    BLS Series ID PCU2092#S


    Producer Price Index Revision - Current Series (PC) [PPI Data Sources]


    Not Seasonally Adjusted (U) [Overview of PPI's]


    Prepared fresh or frozen fish and seafoods industry. (2092) [BLS PPI Homepage]


    Secondary products only (#S) [Commodities-Based PPIs]


    Base period: Dec 1982=100 [Industry-Based PPIs]


    Data are available monthly and annually. [Industry-Based Stage-of-Process Classification]


    [Download Data Page]


    Monthly vs. Annual Data
  • Select period=M13 for annual data.
  • Select period<>M13 for monthly data.
  • [Top of This Page]


    These data relate to SIC 2092 only.


  • Click here for a description of this industry.
  • Click here for a description of other fisheries-related industries.
  • Data for other industries may be obtained at http://146.142.4.24/cgi-bin/srgate by using another SIC in place of 2092 in the BLS Series ID. For additional help, follow the Series ID Formats link.


  • These data relate to secondary products only.


    BLS says "The secondary products index is limited to reflecting the average change in price that these producers receive for products other than fresh or frozen fish and seafood (e.g., canned or cured fish and seafood)."

  • Click here for more information on stage of process classification.
  • Data for primary products and groundfish products are also available at this website.
  • Data for other products may be obtained at http://146.142.4.24/cgi-bin/srgate by using another product code in place of "#P" in the BLS Series ID. For additional help, follow the Series ID Formats link.

  • Industry-based PPI: Prepared fresh or frozen fish and seafoods: Groundfish Products


    BLS Series ID PCU2092#31


    Producer Price Index Revision - Current Series (PC) [PPI Data Sources]


    Not Seasonally Adjusted (U) [Overview of PPI's]


    Prepared fresh or frozen fish and seafoods industry. (2092) [BLS PPI Homepage]


    Groundfish products only (#31) [Commodities-Based PPIs]


    Base period: June 1989=100 [Industry-Based PPIs]


    Data are available monthly and annually. [Industry-Based Stage-of-Process Classification]


    [Top of This Page]


    Monthly vs. Annual Data
  • Select period=M13 for annual data.
  • Select period<>M13 for monthly data.
  • [Top of This Page]


    These data relate to SIC 2092 only.


  • Click here for a description of this industry.
  • Click here for a description of other fisheries-related industries.
  • Data for other industries may be obtained at http://146.142.4.24/cgi-bin/srgate by using another SIC in place of 2092 in the BLS Series ID. For additional help, follow the Series ID Formats link.


  • These data relate to groundfish products only


    BLS definition of groundfish includes: cod, cusk, haddock, hake, perch, pollock, and whiting.

  • Data for primary products and secondary products are also available at this website.
  • Data for other products may be obtained at http://146.142.4.24/cgi-bin/srgate by using another product code in place of "#P" in the BLS Series ID. For additional help, follow the Series ID Formats link.


  • Industry-based PPI: Paperboard Containers and Boxes: Corrugated and Solid Fiber Boxes


    BLS Series ID PCU2653#1


    Producer Price Index Revision - Current Series (PC) [PPI Data Sources]


    Not Seasonally Adjusted (U) [Overview of PPI's]


    Paperboard and Containers and Boxes Industry (265) [BLS PPI Homepage]


    Corrugated Shipping Containers only (#1) [Commodities-Based PPIs]


    Base period: March 1980=100 [Industry-Based PPIs]


    Data are available monthly and annually. [Industry-Based Stage-of-Process Classification]


    [Top of This Page]


    Monthly vs. Annual Data
  • Select period=M13 for annual data.
  • Select period<>M13 for monthly data.
  • [Top of This Page]


    These data relate to SIC 2653 only.


  • Click here for a description of this industry.
  • Click here for a description of other Paper and Allied Products.
  • Data for other industries may be obtained at http://146.142.4.24/cgi-bin/srgate by using another SIC in place of 2653 in the BLS Series ID. For additional help, follow the Series ID Formats link.


  • These data relate to Corrugated shipping containers only


    BLS definition of corrugated and solid fiber boxes includes: boxes, containers, display items, hampers, pads, pallets partitions and sheets.

  • Data for other products may be obtained at http://146.142.4.24/cgi-bin/srgate by using another product code in place of "#1" in the BLS Series ID. For additional help, follow the Series ID Formats link.


  • GDP Price Deflator Summary and Source Information

    IMPORTANT NOTE FOR USERS OF GDP DEFLATOR DATA:

    The base year for the GDP Implicit Price Deflator has changed. The base year is now 1996.

    The GDP Implicit Price Deflator data are from the U.S. Department of Commerce, Bureau of Economic Analysis. They were retrieved from the Federal Reserve Bank of Saint Louis' Federal Reserve Economic Data (FRED) Database at http://www.stls.frb.org/fred/.

    The Gross Domestic Product (GDP) Implicit Price Deflator, often referred to simply as the GDP Deflator, is a quarterly price index calculated by dividing GDP in some period by GDP in the base period. That is, the GDP deflator is the ratio of nominal GDP to real GDP, so the inflation rate from time T-1 to time T can be calculated as the percentage change in the GDP deflator over that time:

    inflation =
    (GDP deflator at T-1) - (GDP deflator at T)
    -------------------------------------------
    GDP deflator at T


    [Download Data Page] [Top of This Page]


    Moody's BAA Bond Rating Source Information

    Moody's BAA Bond Rating data are from the Federal Reserve's G13 release, which may be obtained at http://www.federalreserve.gov/Releases/G13/. Historical monthly and annual data series may be obtained at http://www.bog.frb.fed.us/releases/h15/data.htm.

    Effective August 8, 2000, several changes are being made to the G.13 release: "Note to Users of the G.13 Statistical Release".

    These data are available monthly and annually from 1981-present from the Fisheries Economics Data Program. For monthly data, select month <> 13. For annual data, select month=13.


    [Download Data Page] [Top of This Page]


    ECI Data Source

    All Employment Cost Index data are from the US Department of Labor, Bureau of Labor Statistics. They are available at http://146.142.4.24/cgi-bin/srgate using the BLS Series ID provided in the description of the data series.

    [Data Source] [General Description] [Manufacturing Industry Category] [Seasonal Adjustment] [BLS Resources on the Web]
    [View PDF] [Total Compensation] [Wages and Salaries] [Benefits] [Download Data Page] [Top of this Page]


    General Description of the ECI

    The BLS Employment Cost Index Explanatory Note explains:

    The Employment Cost Index (ECI) is a measure of the change in the cost of labor, free from the influence of employment shifts among occupations and industries. The compensation series includes changes in wages and salaries and employer costs for employee benefits. The wage and salary series and the benefit cost series provide the change for the two components of compensation.

    The June 2000 ECI includes an expanded definition of nonproduction bonuses designed to improve representation of compensation packages offered to employees. In addition to the traditional types of nonproduction bonuses such as attendance bonuses and lump sum payments, the June ECI includes hiring and referral bonuses.

    The entire explanatory note is available at http://www.bls.gov/news.release/eci.tn.htm

    [Data Source] [General Description] [Manufacturing Industry Category] [Seasonal Adjustment] [BLS Resources on the Web]
    [View PDF] [Total Compensation] [Wages and Salaries] [Benefits] [Download Data Page] [Top of this Page]


    Manufacturing Industry Category

    This series contains data for the Manufacturing Industry Category, which is based upon SICs 20-39. This industry category was selected because it contained information on SICs 2077, 2091, 2092, 3556, 3731 and 3732.

    Unfortunately, ECI data are not available for SICs 0912 and 0913.

    [Data Source] [General Description] [Manufacturing Industry Category] [Seasonal Adjustment] [BLS Resources on the Web]
    [View PDF] [Total Compensation] [Wages and Salaries] [Benefits] [Download Data Page] [Top of this Page]


    Seasonal Adjustment

    These data are NOT seasonally adjusted. Seasonally adjusted data for some series may be obtained from BLS at http://stats.bls.gov/ecthome.htm.

    [Data Source] [General Description] [Manufacturing Industry Category] [Seasonal Adjustment] [BLS Resources on the Web]
    [View PDF] [Total Compensation] [Wages and Salaries] [Benefits] [Download Data Page] [Top of this Page]


    BLS Resources on the Web

    You may find the following websites useful when using the Employment Cost Index:

    [Data Source] [General Description] [Manufacturing Industry Category] [Seasonal Adjustment] [BLS Resources on the Web]
    [View PDF] [Total Compensation] [Wages and Salaries] [Benefits] [Download Data Page] [Top of this Page]


    Employment Cost Index: Manufacturing: Total Compensation

    BLS Series ID: ECU12402I

    Employment Cost Index (EC)
    Not Seasonally Adjusted (U)
    Total Compensation (1)
    Manufacturing (240)
    Private Industry (2)
    Index (I)

    Base period: 1989, Q2 = 100.0

    The BLS Employment Cost Index Explanatory Note explains

    The Employment Cost Index (ECI) is a measure of the change in the cost of labor, free from the influence of employment shifts among occupations and industries. The compensation series includes changes in wages and salaries and employer costs for employee benefits. The wage and salary series and the benefit cost series provide the change for the two components of compensation.
    The entire explanatory note is available at
    http://www.bls.gov/news.release/eci.tn.htm

    These data are NOT seasonally adjusted. Seasonally adjusted data for some series may be obtained from BLS at http://stats.bls.gov/ecthome.htm.

    This is an index for total compensation which includes wages, salaries, and employer costs for employee benefits. Click here for more information on what these include. If you are interested in wage and salary information only, click here. If you are interested in benefit information only, click here.

    This series contains data for the Manufacturing Industry Category, which is based upon SICs 20-39. This industry category was selected because it contained information on SICs 2077, 2091, 2092, 3556, 3731 and 3732. Unfortunately, ECI data are not available for SICs 0912 and 0913.

    To view a pdf file with full documentation on the Employment Cost Index, click here. You will need a viewer, such as Adobe Acrobat Reader to read this file. If you do not have such a viewer, click here to download Adobe Acrobat Reader.

    [Data Source] [General Description] [Manufacturing Industry Category] [Seasonal Adjustment] [BLS Resources on the Web]
    [View PDF] [Total Compensation] [Wages and Salaries] [Benefits] [Download Data Page] [Top of this Page]


    Employment Cost Index: Manufacturing: Wages and Salaries

    BLS Series ID: ECU22402I

    Employment Cost Index (EC)
    Not Seasonally Adjusted (U)
    Wages and Salaries (2)
    Manufacturing (240)
    Private Industry (2)
    Index (I)

    The BLS Employment Cost Index Explanatory Note explains

    The Employment Cost Index (ECI) is a measure of the change in the cost of labor, free from the influence of employment shifts among occupations and industries. The compensation series includes changes in wages and salaries and employer costs for employee benefits. The wage and salary series and the benefit cost series provide the change for the two components of compensation.
    The entire explanatory note is available at
    http://www.bls.gov/news.release/eci.tn.htm

    These data are NOT seasonally adjusted. Seasonally adjusted data for some series may be obtained from BLS at http://stats.bls.gov/ecthome.htm.

    This is an index for wages and salaries.

    Wages and salaries are defined as the hourly straight-time wage rate or, for workers not paid on an hourly basis, straight-time earnings divided by the corresponding hours. Straight-time wage and salary rates are total earnings before payroll deductions, excluding premium pay for overtime and for work on weekends and holidays, shift differentials, and nonproduction bonuses such as lump-sum payments provided in lieu of wage increases. Production bonuses, incentive earnings, commission payments, and cost-of-living adjustments are included in straight-time wage and salary rates.
    - -BLS Employment Cost Index Explanatory Note available at http://www.bls.gov/news.release/eci.tn.htm

    It is NOT a measure for benefits. If you are interested in an ECI for benefits only, click here. If you are interested in an ECI for total compensation, click here.

    This series contains data for the Manufacturing Industry Category, which is based upon SICs 20-39. This industry category was selected because it contained information on SICs 2077, 2091, 2092, 3556, 3731 and 3732. Unfortunately, ECI data are not available for SICs 0912 and 0913.

    To view a pdf file with full documentation on the Employment Cost Index, click here. You will need a viewer, such as Adobe Acrobat Reader to read this file. If you do not have such a viewer, click here to download Adobe Acrobat Reader.

    [Data Source] [General Description] [Manufacturing Industry Category] [Seasonal Adjustment] [BLS Resources on the Web]
    [View PDF] [Total Compensation] [Wages and Salaries] [Benefits] [Download Data Page] [Top of this Page]


    Employment Cost Index: Manufacturing: Benefits

    BLS Series ID: ECU32402I

    Employment Cost Index (EC)
    Not Seasonally Adjusted (U)
    Benefits (3)
    Manufacturing (240)
    Private Industry (2)
    Index (I)

    The BLS Employment Cost Index Explanatory Note explains

    The Employment Cost Index (ECI) is a measure of the change in the cost of labor, free from the influence of employment shifts among occupations and industries. The compensation series includes changes in wages and salaries and employer costs for employee benefits. The wage and salary series and the benefit cost series provide the change for the two components of compensation.
    The entire explanatory note is available at
    http://www.bls.gov/news.release/eci.tn.htm

    These data are NOT seasonally adjusted. Seasonally adjusted data for some series may be obtained from BLS at http://stats.bls.gov/ecthome.htm.

    This is an index for benefits. It does NOT include wage and salary information. If you are interested in wage and salary information, click here. If you are interested in an ECI for total compensation, click here.

    This series contains data for the Manufacturing Industry Category, which is based upon SICs 20-39. This industry category was selected because it contained information on SICs 2077, 2091, 2092, 3556, 3731 and 3732. Unfortunately, ECI data are not available for SICs 0912 and 0913.

    To view a pdf file with full documentation on the Employment Cost Index, click here. You will need a viewer, such as Adobe Acrobat Reader to read this file. If you do not have such a viewer, click here to download Adobe Acrobat Reader.

    [Data Source] [General Description] [Manufacturing Industry Category] [Seasonal Adjustment] [BLS Resources on the Web]
    [View PDF] [Total Compensation] [Wages and Salaries] [Benefits] [Download Data Page] [Top of this Page]


    Average Wages for Fishers, All Industries: Alaska, California, Oregon, and Washington


    Average Wages for Fishers: Description of Covered Employment and Wages Program

    Wage data from each state is a part of the Bureau of Labor Statistic's Covered Employment and Wages Program, often referred to as the ES-202 program.

    The BLS Overview of the Covered Employment and Wages Program explains:

    The Covered Employment and Wages Program, commonly referred to as the ES-202 program, is a cooperative program involving the Bureau of Labor Statistics (BLS) of the U.S. Department of Labor and the State Employment Security Agencies (SESAs). The ES-202 program produces a comprehensive tabulation of employment and wage information for workers covered by State unemployment insurance (UI) laws and Federal workers covered by the Unemployment Compensation for Federal Employees (UCFE) program. Publicly available files include data on the number of establishments, monthly employment, and quarterly wages, by industry, at the 4-digit Standard Industrial Classification (SIC) level, by county, by ownership sector, for the entire United States&

    Employment data under the ES-202 program represent the number of covered workers who worked during, or received pay for, the pay period including the 12th of the month. Excluded are members of the armed forces, the self-employed, proprietors, domestic workers, unpaid family workers, and railroad workers covered by the railroad unemployment insurance system. Wages represent total compensation paid during the calendar quarter, regardless of when services were performed. Included in wages are pay for vacation and other paid leave, bonuses, stock options, tips, the cash value of meals and lodging, and in some States, contributions to deferred compensation plans (such as 401(k) plans). The ES-202 program does provide partial information on agricultural industries and employees in private households.

    BLS's Covered Employment and Wages home page houses more detailed information about the program, including the full overview and answers to frequently asked questions.

    [Avg. Wages for Fishers] [Data Format] [Zeros] [Industries]
    [Program Description] [Variable Summary] [Update Schedule] [Contacts/Resources]
    [Alaska] [California] [Oregon] [Washington]
    [Download Data Page] [PDF version] [Top of This Page]

    Average Wages for Fishers: Industry Definitions

    Data is available for each of the following Standard Industry Classifications:

    [Avg. Wages for Fishers] [Data Format] [Zeros] [Industries]
    [Program Description] [Variable Summary] [Update Schedule] [Contacts/Resources]
    [Alaska] [California] [Oregon] [Washington]
    [Download Data Page] [PDF version] [Top of This Page]

    Interpretation of Zeros

    Zeros in a data cell indicate that the data for that cell are either confidential or missing.

    For states which provide data on a quarterly basis (AK, CA, and WA), there are likely to be some missing data from the most recent year. In these cases, the cells for the missing data are set equal to zero. For example, assume that Quarter 3 1999 is the most recent quarter of data available for a given state. All of the following variables would be set equal to zero: Empl_Oct, Empl_Nov, Empl_Dec, Earn_Q4, and Units_Q4. Empl_Q4 and Aearn_Q4 would necessarily result in a zero value as they are functions exclusively of the previously mentioned variables. Empl_Ann, Earn_Ann and AEarn_An would not be equal to zero as they are based upon other, presumably non-zero, variables. They would however be missing Q4 data and, therefore, should not be interpreted at true annual values.

    Zeros in data cells for the most recent quarter available (which does vary between states) and quarters prior to the most recent quarter available may be interpreted as an indication of confidential data.

    [Avg. Wages for Fishers] [Data Format] [Zeros] [Industries]
    [Program Description] [Variable Summary] [Update Schedule] [Contacts/Resources]
    [Alaska] [California] [Oregon] [Washington]
    [Download Data Page] [PDF version] [Top of This Page]

    Average Wages for Fishers: Data Format

    The average wage data available to the Fisheries Economics Data Program from each state has been standardized and combined into a single file for easy retrieval. Individual state data files and a combined state data file are available to be downloaded.

    Each wage file is available currently in two formats: as an ASCII comma-delimited and as an SPSS data file. The combined file (AK, CA, OR, and WA) is also available as a MS Excel 5.0 file. In the future, these data will also be available in PDF format.

    [Avg. Wages for Fishers] [Data Format] [Zeros] [Industries]
    [Program Description] [Variable Summary] [Update Schedule] [Contacts/Resources]
    [Alaska] [California] [Oregon] [Washington]
    [Download Data Page] [PDF version] [Top of This Page]

    Average Wages for Fishers: Variable Summary

    See individual state wage descriptions (AK, CA, OR, WA) for notes/data explanations including interpretations of zeros.

    Variable Description Notes
    Year Year to which data applies -
    State State from which data originates -
    SIC Standard Industry Classification Industries included:
    0912 Fisheries: Finfish
    0913 Fisheries: Shellfish
    2077 Animal and Marine Fats and Oils
    2091 Canned and Cured Fish and Seafoods
    2092 Prepared Fresh or Frozen Fish and Seafoods
    3556 Food Products Machinery
    3731 Ship Building and Repairing
    3732 Boat Building and Repairing
    5142 Packaged Frozen Foods
    5146 Fish and Seafoods
    Empl_Jan Number of workers employed in January -
    Empl_Feb Number of workers employed in February -
    Empl_Mar Number of workers employed in March -
    Empl_Apr Number of workers employed in April -
    Empl_May Number of workers employed in May -
    Empl_Jun Number of workers employed in June -
    Empl_Jul Number of workers employed in July -
    Empl_Aug Number of workers employed in August -
    Empl_Sep Number of workers employed in September -
    Empl_Oct Number of workers employed in October -
    Empl_Nov Number of workers employed in November -
    Empl_Dec Number of workers employed in December -
    Empl_Q1 Total Employee-Months in Q1 Empl_Q1= Empl_jan, + Empl_feb + Empl_mar
    Empl_Q2 Total Employee-Months in Quarter 2 Empl_Q2= Empl_apr + Empl_may + Empl_jun
    Empl_Q3 Total Employee-Months in Quarter 3 Empl_Q3= Empl_jul + Empl_aug + Empl_sep
    Empl_Q4 Total Employee-Months in Quarter 4 Empl_Q4= Empl_oct + Empl_nov + Empl_dec
    Empl_Ann Total Employee-Months in Year Empl_Q1 + Empl_Q2 + Empl_Q3 + Empl_Q4
    Earn_Q1 Total Earnings in Quarter 1 -
    Earn_Q2 Total Earnings in Quarter 2 -
    Earn_Q3 Total Earnings in Quarter 3 -
    Earn_Q4 Total Earnings in Quarter 4 -
    Earn_Ann Total Earnings in Year -
    AEarn_Q1 Average Monthly Earnings in Quarter 1 Aearn_q1= Earn_q1/ Empl_q1
    AEarn_Q2 Average Monthly Earnings in Quarter 2 Aearn_q2= Earn_q2/ Empl_q2
    AEarn_Q3 Average Monthly Earnings in Quarter 3 Aearn_q3= Earn_q3/ Empl_q3
    AEarn_Q4 Average Monthly Earnings in Quarter 4 Aearn_q4= Earn_q4/ Empl_q4
    AEarn_An Average Monthly Earnings in Year Aearn_an= Earn_ann/ Empl_ann
    Units_Q1 # Reporting Units in Quarter 1 Quarterly reporting units are an average of the annual units (annual units/4) for some states and set equal to Q4 units for other states...see individual state descriptions for more detail.
    Units_Q2 # Reporting Units in Quarter 2
    Units_Q3 # Reporting Units in Quarter 3
    Units_Q4 # Reporting Units in Quarter 4
    [Avg. Wages for Fishers] [Data Format] [Zeros] [Industries]
    [Program Description] [Variable Summary] [Update Schedule] [Contacts/Resources]
    [Alaska] [California] [Oregon] [Washington]
    [Download Data Page] [PDF version] [Top of This Page]

    Variable Descriptions

    Year

    Year is a four digit year to which the data applies. This information is provided directly by the states.

    State

    State is the state from which data originates. This information is added by the Economics Data Program.

    SIC

    SIC is the Standard Industry Classification. Please see Industries for a list of industries for which data are collected by the Economics Data Program. This information is provided directly by the states.

    Empl_month (i.e., Empl_jan through Empl_dec)

    Empl_month gives the employment count for a given month. This information is provided directly by the states.

    Following is an excerpt from the BLS Handbook of Methods, Chapter 5 describing the employment count. The full text of this note is available in the Handbook in the BLS Information section.

    Employment data represent the number of workers on the payroll during the pay period including the 12th day of the month. The pay period varies in length from employer to employer; for most employers, it is a 7-day period but not necessarily a calendar week. An employer who pays on more than one basis (such as weekly for production employees and semimonthly for office employees) reports the sum of the number of workers on each type of payroll for the period.

    The employment count includes all corporation officials, executives, supervisory personnel, clerical workers, wage earners, pieceworkers, and part-time workers. Workers are reported in the State and county of the physical location of their job. Persons on paid sick leave, paid holiday, paid vacation, and so forth are included, but those on leave without pay for the entire payroll period are excluded.

    Persons on the payroll of more than one firm are counted in each firm. Workers are counted even though their wages may be nontaxable for UI purposes during that period (having reached the taxable limit for the year).

    The employment count excludes employees who earned no wages during the entire applicable period because of work stoppages, temporary layoffs, illness, or unpaid vacations, and employees who earned wages during the month but not during the applicable pay period.


    Empl_Q1-4 and Empl_ann

    Empl_Q1, Empl_Q2, Empl_Q3, Empl_Q4 and Empl_ann are totals computed by the Economics Data Program based on Empl_month data according to the formulas in the Notes section of the variable summary table.

    Empl_ann is calculated regardless of whether data are missing. This means that for the most recent year, Empl_ann may not represent a true annual total. For example, assume that the most recent quarter of data available is Quarter 3. For that year, the Empl_ann = empl_q1 + empl_q2 + empl_q3 (because empl_q4 = 0).

    Empl_q1-4 and empl_ann give the number of employee-months in the respective period, not necessarily the number of unique employees in that period. For example, it may be that Jane Doe worked in Jan and Feb. She would be counted as one employee in January and as one employee in February. Thus, she would account for 2 employee-months in total employment for the year, even though she is indeed only one employee.

    Earn_Q1-4

    Earn_Q1, Earn_Q2, Earn_Q3, and Earn_Q4 are the total quarterly earnings provided directly by the states.

    Following is an excerpt from the BLS Handbook of Methods, Chapter 5 describing earnings/total wages. The full text of this note is available in the Handbook in the BLS Information section.

    Total wages, for purposes of the quarterly UI reports submitted by employers in private industry in most States, include gross wages and salaries, bonuses, stock options, tips and other gratuities, and the value of meals and lodging, where supplied. In some of the States, employer contributions to certain deferred compensation plans, such as 401(k) plans, are included in total wages. Total wages, however, do not include employer contributions to Old-age, Survivors', and Disability Insurance (OASDI); health insurance; unemployment insurance; workers' compensation; and private pension and welfare funds.3

    In most States, firms report the total wages paid during the calendar quarter, regardless of the timing of the services performed. Under laws of a few States, however, the employers report total wages earned during the quarter (payable) rather than actual amounts paid.

    For Federal workers, wages represent the gross amount of all payrolls for all pay periods paid within the quarter. This gross amount includes cash allowances and the cash equivalent of any type of remuneration. It includes all lump-sum payments for terminal leave, withholding taxes, and retirement deductions. Federal employee remuneration generally covers the same types of services as those for workers in private industry.


    Earn_Ann

    Earn_Ann is a total computed by the Economics Data Program based on Earn_Q1-4 data according to the formula in the Notes section of the variable summary table.

    Earn_ann is calculated regardless of whether data are missing. This means that for the most recent year, Earn_ann may not represent a true annual total. For example, assume that the most recent quarter of data available is Quarter 3. For that year, the Earn_ann = earn_q1 + earn_q2 + earn_q3 (because earn_q4 = 0).

    AEarn_Q1-4 and AEarn_ann

    AEarn_Q1, Aearn_Q2, Aearn_Q3, Aearn_Q4 and Aearn_ann are averages computed by the Economics Data Program based on Earn_Q1-4 and Empl_month data according to the formulas in the Notes section of the variable summary table.

    Units_Q1-4

    Units_Q1, Units_Q2, Units_Q3 and Units_Q4 indicate the number of reporting units or statistical entities to which the earnings and employment data apply. These data are provided directly by the states.

    Following is an excerpt from the BLS Handbook of Methods, Chapter 5 describing reporting units.

    An establishment is an economic unit, such as a farm, mine, factory, or store, which produces goods or provides services. It usually is at a single physical location and engaged in one, or predominantly one, type of economic activity, for which a single industrial classification may be applied. Occasionally, a single physical location encompasses two or more distinct and significant activities. Each activity should be reported as a separate establishment if separate records are kept and the various activities are classified under different 4-digit Standard Industrial Classification (SIC) codes.

    Most employers have only one establishment; thus, the establishment is the predominant reporting unit or statistical entity for reporting employment and wage data. Most employers who operate more than one establishment in a State file a Multiple Worksite Report (MWR) each quarter, in addition to their quarterly UI Contribution Report. The MWR form is used to collect separate employment and wage data for each establishment of these employers. Some very small multi-establishment employers do not file a MWR. When the total employment in an employer's secondary establishments (all establishments other than the largest) is less than 10, the employer will generally file a consolidated report for all establishments. Some employers either cannot or will not report at the establishment level and thus group establishments into one consolidated unit, or possibly several units, though not at the establishment level.

    As a result of these reporting rules, the number of reporting units is always larger than the number of employers (or government agencies) but smaller than the number of establishments (or installations).

    [Avg. Wages for Fishers] [Data Format] [Zeros] [Industries]
    [Program Description] [Variable Summary] [Update Schedule] [Contacts/Resources]
    [Alaska] [California] [Oregon] [Washington]
    [Download Data Page] [PDF version] [Top of This Page]

    Average Wages for Fishers: Data Update Schedule

    Each of the states process labor data on a different schedule. This results in variations in the most recent data available from the Fisheries Economics Data Program. The following table should help users determine what data is available and when to check back for updated data.

    State Currently Available Next Update
    Most Recent Data Date of Last Update Data Expected Expected Date
    Alaska 2000, Quarter 4 July 10, 2001 2001 Quarter 31 September 2001
    California 2001, Quarter 1 January 10, 2002 2001 Quarter 2 March 2002
    Oregon 2001, Quarter 4 May 20, 2002 Quarter 1, 2002 Early October 2002
    Washington 2001, Quarter 4 May 20, 2002 2002, Quarter 1 October 2002
    [Avg. Wages for Fishers] [Data Format] [Zeros] [Industries]
    [Program Description] [Variable Summary] [Update Schedule] [Contacts/Resources]
    [Alaska] [California] [Oregon] [Washington]
    [Download Data Page] [PDF version] [Top of This Page]

    Average Wages for Fishers: Contacts and Additional Resources

    ES-202 Data Contacts

    The following people may be able to provide more detailed answers about data content and interpretation.

    Alaska Dept of Labor,
    Research and Analysis Section
    Sara Verrelli
    sara_verrelli@labor.state.ak.us
    (907) 465-4500
    California Dept of Labor
    Labor Market Information Division
    Information Services Group
    John Vaughn
    lmid.jvaughn@edd.ca.gov
    (916)262-2296
    (916)262-2443 FAX
    Oregon Employment Department
    Research & Analysis Section
    Ken Lux
    Kenneth.D.Lux@state.or.us
    (503) 947-1248
    Washington State Employment & Training Division,
    Labor Market and Economic Analysis
    Labor Market Information

    John Wines
    Jwines@ESD.WA.GOV
    (360) 438-4843
    1-800-215-1617

    Bureau of Labor Statistics Eugene Becker
    becker_e@bls.gov

    Questions about data format, file types, downloading, etc. should be directed to Geana Tyler at (206) 526-6683 or geana_tyler@psmfc.org.

    Additional Resources

    BLS has suggested the following resources related to the ES-202 program:

    The following websites may also be useful when using ES-202 data:

    [Avg. Wages for Fishers] [Data Format] [Zeros] [Industries]
    [Program Description] [Variable Summary] [Update Schedule] [Contacts/Resources]
    [Alaska] [California] [Oregon] [Washington]
    [Download Data Page] [PDF version] [Top of This Page]

    Average Wages for Fishers, All Industries: Alaska

    Data Source

    Alaska data are from the Alaska Department of Labor, Research and Analysis Section, ES-202 Unit. The contact there is Sara Verrelli who may be reached at sara_verrelli@labor.state.ak.us or at (907) 465-4500.

    Comments

    These data follow the format of the combined file with no exceptions.

    Quarterly reporting units are supplied on a quarterly basis and are not an annual average.

    As Alaska provides data on a quarterly basis, zeros in records for the most recent year of data may indicate that the data is not yet available. For example, assume that the most recent data are for Quarter 3 of 1999. Zeros in the quarter 4 variables (e.g., earn_q4, aearn_q4, empl_nov) would indicate that the data for those cells are missing. These zeros do not indicate that the data are confidential. Zeros in cells associated with data prior to and including Quarter 3, 1999 would indicate confidential data in this example.

    Another result of being provided quarterly data is that totals and averages may be missing some values. In the example above, annual employment would be based upon employment counts from January through September and would NOT include employment counts for October though December. The same is applicable for total annual earnings and average annual earnings.


    [Avg. Wages for Fishers] [Data Format] [Zeros] [Industries]
    [Program Description] [Variable Summary] [Update Schedule] [Contacts/Resources]
    [Alaska] [California] [Oregon] [Washington]
    [Download Data Page] [PDF version] [Top of This Page]

    Average Wages for Fishers, All Industries: California

    Data Source

    California data are from the State of California, EDD - Labor Market Information Division, from the ES202 detail file. The contact there is John Vaughn who may be reached at lmid.jvaughn@edd.ca.gov or at (916) 262-2296.

    Comments

    These data follow the format of the combined file with no exceptions.

    Quarterly reporting units are supplied on a quarterly basis and are not an annual average.

    As California provides data on a quarterly basis, zeros in records for the most recent year of data may indicate that the data is not yet available. For example, assume that the most recent data are for Quarter 3 of 1999. Zeros in the quarter 4 variables (e.g., earn_q4, aearn_q4, empl_nov) would indicate that the data for those cells are missing. These zeros do not indicate that the data are confidential. Zeros in cells associated with data prior to and including Quarter 3, 1999 would indicate confidential data in this example.

    Another result of being provided quarterly data is that totals and averages may be missing some values. In the example above, annual employment would be based upon employment counts from January through September and would NOT include employment counts for October though December. The same is applicable for total annual earnings and average annual earnings.


    [Avg. Wages for Fishers] [Data Format] [Zeros] [Industries]
    [Program Description] [Variable Summary] [Update Schedule] [Contacts/Resources]
    [Alaska] [California] [Oregon] [Washington]
    [Download Data Page] [PDF version] [Top of This Page]

    Average Wages for Fishers, All Industries: Oregon

    Data Source

    Oregon data are from the State of Oregon, Employment Department, Research & Analysis Section. The contact there is Ken Lux who may be reached at Kenneth.D.Lux@state.or.us or by phone at (503) 947-1248.

    Comments

    These data follow the format of the combined file with few exceptions.

    Oregon provides labor and wage information on an annual basis, NOT on a quarterly basis. You may interpret all zeros as an indication of confidential data and assume all totals are not missing any (non-confidential) data..

    Oregon supplies annual reporting units, NOT quarterly reporting units. The quarterly reporting units are an average of the annual units, that is annual reporting units divided by four.

    [Avg. Wages for Fishers] [Data Format] [Zeros] [Industries]
    [Program Description] [Variable Summary] [Update Schedule] [Contacts/Resources]
    [Alaska] [California] [Oregon] [Washington]
    [Download Data Page] [PDF version] [Top of This Page]

    Average Wages for Fishers, All Industries: Washington

    Data Source

    The data are from the State of Washington, Employment & Training Division, Labor Market and Economic Analysis, Labor Market Information: Covered Employment and Payrolls in Washington State by County and Industry. Contact: John Wines who may be reached by phone at (800) 215-1617 or by email at Jwines@ESD.WA.GOV.

    Comments

    These data follow the format of the combined file with the following exceptions:

    Reporting Units

    The number of reporting units is not provided for the entire year. The State uses the number of units in the 4th Quarter for annual calculations. The number of reporting units is provided for each quarter.

    Combination of Original Data Sources

    The last update to this dataset was provided on September 26, 2000 and contained 1999 Quarter 4 data.

    For 1995-1996 data, the Fisheries Economics Data Program was provided with data two datasets: one with the quarterly data and one with annual data. The annual data was provided on Friday 11 Dec and the quarterly data were provided on Monday 14 Dec. These two datasets have been combined into one for ease of use.  2000 data only available in annual format.  Quarter 4 values are actually annual values.

    Data originally from the annual data are contained in the following variables: Year, SIC, # Empl_jan, Empl_feb, Empl_mar, Empl_apr, Empl_may, Empl_jun, Empl_jul, Empl_aug, Empl_sep, Empl_oct, Empl_nov, Empl_dec, and Earn_ann.

    Data originally from the quarterly data are contained in the following variables: Year, SIC, Earn_q1,Earn_q2, Earn_q3, Earn_q4, Units_q1, Units_q2, Units_q3, and Units_q4.

    Users of this data should be aware that the total quarterly earnings do NOT sum to the total annual earnings for these years. This is due to the data being extracted on different dates. John Haws suggests that the annual data are probably the more accurate of the two, given that the annual data are created after the quarterly data. However, the differences are small.
    [Avg. Wages for Fishers] [Data Format] [Zeros] [Industries]
    [Program Description] [Variable Summary] [Update Schedule] [Contacts/Resources]
    [Alaska] [California] [Oregon] [Washington]
    [Download Data Page] [PDF version] [Top of This Page]

    Alaska Fuel Prices: Overview

    Fuel docks at selected ports on the West Coast and in Alaska will be surveyed monthly to create a marine fuel price index.


    Alaska Fuel Prices: Selected Ports

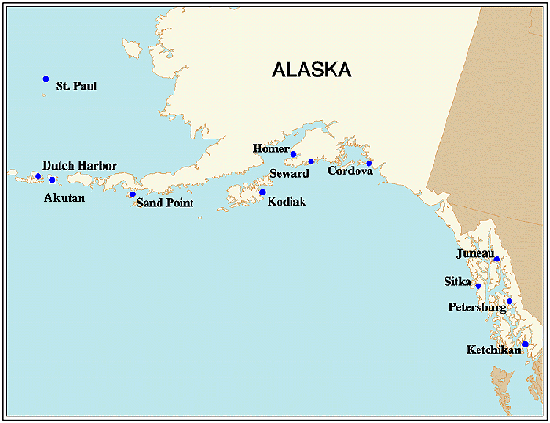
    Ports were selected through discussions with ADF&G and NPFMC staff. The selected ports were chosen to include ports with significant revenue generation and which were broadly geographically representative of commercial fishing ports in Alaska. The following ports were selected:

    Map of Alaska Ports

    Alaska

    Akutan

    Cordova

    Dutch Harbor

    Homer

    Juneau

    Ketchican

    Kodiak

    Petersburg

    Sand Point

    Seward

    Sitka

    St. Paul Island

    [Overview] [Port Selection Method] [Selected Ports] [Fuel Docks] [Alaska Fuel Prices] [California Fuel Prices] [Download Data Page]
    [Data Collected] [Date of Collection] [Data Availability] [Data File Structure] [Oregon Fuel Prices] [Washington Fuel Prices] [Top of This Page]

    Alaska Fuel Prices: Date of Collection

    Fuel prices will be collected the first Tuesday of each month, given the following contingencies.

    [Overview] [Port Selection Method] [Selected Ports] [Fuel Docks] [Alaska Fuel Prices] [California Fuel Prices] [Download Data Page]
    [Data Collected] [Date of Collection] [Data Availability] [Data File Structure] [Oregon Fuel Prices] [Washington Fuel Prices] [Top of This Page]

    Alaska Fuel Prices: Fuel Docks

    At least one fuel dock in each selected port will be surveyed. Each fuel dock can be uniquely identified by its "Fuel Dock Identifier". This identifier was formed by using the 3 letter AKFIN port code for the port in which the dock is located followed by a sequential number. (For example, KTN2 identifies the second fuel dock surveyed in Ketchican, AK.) A fuel dock's identifier will remain unique to that dock throughout the collection of this data to allow a single dock to be identified over time.

    Fuel docks were selected on the following basis:

    1. if a fuel dock was listed in the "Port Guide" appearing in the 1998 National Fisherman's Journal Pilothouse Guide and Yellow Pages, that dock is included.
    2. if a fuel dock was not located through the first method for a given port, the US West Dex Internet Yellow Pages were used to locate a fuel dock at that port.
    3. In some cases, the Port Office is called in lieu of a fuel dock, per se.
    [Overview] [Port Selection Method] [Selected Ports] [Fuel Docks] [Alaska Fuel Prices] [California Fuel Prices] [Download Data Page]
    [Data Collected] [Date of Collection] [Data Availability] [Data File Structure] [Oregon Fuel Prices] [Washington Fuel Prices] [Top of This Page]

    Alaska Fuel Prices: Price Data Collected

    The data to be collected are the cash price before tax (where applicable) of 600 gallons of #2 marine diesel.

    [Overview] [Port Selection Method] [Selected Ports] [Fuel Docks] [Alaska Fuel Prices] [California Fuel Prices] [Download Data Page]
    [Data Collected] [Date of Collection] [Data Availability] [Data File Structure] [Oregon Fuel Prices] [Washington Fuel Prices] [Top of This Page]

    Alaska Fuel Prices: Data Availability

    Fuel price data will be available by state or in a combined West Coast/Alaska file.

    These data will be entered made available on this website in SPSS and ASCII formats by the second Tuesday of each month.

    [Overview] [Port Selection Method] [Selected Ports] [Fuel Docks] [Alaska Fuel Prices] [California Fuel Prices] [Download Data Page]
    [Data Collected] [Date of Collection] [Data Availability] [Data File Structure] [Oregon Fuel Prices] [Washington Fuel Prices] [Top of This Page]

    Alaska Fuel Prices: Data File Structure and Variable Formats

    Alaska fuel price data are in the same format as West Coast fuel prices. Click here to view that structure.

    [Overview] [Port Selection Method] [Selected Ports] [Fuel Docks] [Alaska Fuel Prices] [California Fuel Prices] [Download Data Page]
    [Data Collected] [Date of Collection] [Data Availability] [Data File Structure] [Oregon Fuel Prices] [Washington Fuel Prices] [Top of This Page]

    West Coast Fuel Prices: California

    The series of California fuel prices is a subset of the West Coast Fuel Prices data collection. California data follows the same format and methodology as the larger set. The only difference is that the information has been restricted to the following California ports: Bogeda Bay, Crescent City, Eureka, Fort Bragg, Monterey, Morro Bay, Moss Landing, Port Hueneme, Princeton (Half Moon Bay), San Francisco, San Pedro, Santa Barbara and Sausalito.

    For more information about the West Coast Fuel Prices data collection project, click here.

    [Overview] [Port Selection Method] [Selected Ports] [Fuel Docks] [Alaska Fuel Prices] [California Fuel Prices] [Download Data Page]
    [Data Collected] [Date of Collection] [Data Availability] [Data File Structure] [Oregon Fuel Prices] [Washington Fuel Prices] [Top of This Page]

    West Coast Fuel Prices: Oregon

    The series of Oregon fuel prices is a subset of the West Coast Fuel Prices data collection. Oregon data follows the same format and methodology as the larger set. The only difference is that the information has been restricted to the following Oregon ports: Astoria, Brookings, Coos Bay, Depoe Bay, Florence, Gold Beach, Newport, Tillamook/Garibaldi and Winchester Bay.

    For more information about the West Coast Fuel Prices data collection project, click here.

    [Overview] [Port Selection Method] [Selected Ports] [Fuel Docks] [Alaska Fuel Prices] [California Fuel Prices] [Download Data Page]
    [Data Collected] [Date of Collection] [Data Availability] [Data File Structure] [Oregon Fuel Prices] [Washington Fuel Prices] [Top of This Page]

    West Coast Fuel Prices: Washington

    The series of Washington fuel prices is a subset of the West Coast Fuel Prices data collection. Washington data follows the same format and methodology as the larger set. The only difference is that the information has been restricted to the following Washington ports: Anacortes, Bellingham Bay, Blaine, Everett, Ilwaco/Chinook, Neah Bay, Olympia, Port Angeles, Port Townsend, Seattle, Shelton and Westport.

    For more information about the West Coast Fuel Prices data collection project, click here.

    [Overview] [Port Selection Method] [Selected Ports] [Fuel Docks] [Alaska Fuel Prices] [California Fuel Prices] [Download Data Page]
    [Data Collected] [Date of Collection] [Data Availability] [Data File Structure] [Oregon Fuel Prices] [Washington Fuel Prices] [Top of This Page]

    West Coast Fuel Prices: Overview

    Fuel docks at selected ports on the West Coast and in Alaska will be surveyed monthly to create a marine fuel price index.


    West Coast Fuel Prices: Port Selection Method

    Ports were selected if::

    * Revenue generation figures are based upon revenue data associated with all species from PacFIN on 30 Dec 98.

    [Overview] [Port Selection Method] [Selected Ports] [Fuel Docks] [Alaska Fuel Prices] [California Fuel Prices] [Download Data Page]
    [Data Collected] [Date of Collection] [Data Availability] [Data File Structure] [Oregon Fuel Prices] [Washington Fuel Prices] [Top of This Page]

    West Coast Fuel Prices: Selected Ports

    The following ports were selected:

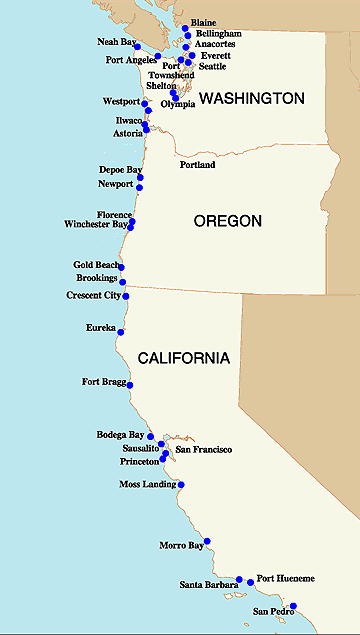
    Map of Ports

    Washington

    Anacortes

    Olympia

    Bellingham Bay

    Port Angeles

    Blaine

    Port Townsend

    Everett

    Seattle

    Ilwaco/Chinook

    Shelton

    Neah Bay

    Westport

    Oregon

    Astoria

    Newport

    Brookings

    Depoe Bay

    Winchester Bay


    Florence


    Gold Beach


    California

    Bodega Bay

    Port Hueneme

    Crescent City

    Princeton

    Eureka

    San Francisco

    Fort Bragg

    San Pedro

    Morro Bay

    Santa Barbara

    Moss Landing

    Sausalito

    * Terminal Island (CA) and Willapa Bay (WA) were excluded from this list due to their extremely close proximity to other ports from which price data are already being collected.

    * Tillamook/Garibaldi was excluded as the fuel dock does not carry #2 marine diesel.

    * Monterey Bay was excluded as we were unable to contact the fuel dock for several consecutive months.

    * One of the two fuel docks in Newport (NEW1) was dropped after the April 1999 price collection as it is no longer a fuel dock.

    * Port Orford was excluded as we were unable to contact the fuel dock for several consecutive months.

    [Overview] [Port Selection Method] [Selected Ports] [Fuel Docks] [Alaska Fuel Prices] [California Fuel Prices] [Download Data Page]
    [Data Collected] [Date of Collection] [Data Availability] [Data File Structure] [Oregon Fuel Prices] [Washington Fuel Prices] [Top of This Page]

    West Coast Fuel Prices: Date of Collection

    Fuel prices will be collected the first Tuesday of each month, given the following contingencies.

    [Overview] [Port Selection Method] [Selected Ports] [Fuel Docks] [Alaska Fuel Prices] [California Fuel Prices] [Download Data Page]
    [Data Collected] [Date of Collection] [Data Availability] [Data File Structure] [Oregon Fuel Prices] [Washington Fuel Prices] [Top of This Page]

    West Coast Fuel Prices: Fuel Docks

    At least one fuel dock in each selected port will be surveyed. Each fuel dock can be uniquely identified by its "Fuel Dock Identifier". This identifier was formed by using the 3 letter PacFIN port code for the port in which the dock is located followed by a sequential number. (For example, SEA4 identifies the fourth fuel dock surveyed in Seattle, WA.) A fuel dock's identifier will remain unique to that dock throughout the collection of this data to allow a single dock to be identified over time.

    Fuel docks were selected on the following basis:

    1. If a fuel dock was included in NMFS SW Region's fuel price collection and that dock's phone number is still operational, that dock is included.
    2. If a fuel dock was listed in the "Port Guide" appearing in the 1998 National Fisherman's Journal Pilothouse Guide and Yellow Pages, that dock is included.
    3. If a fuel dock was not located through either of the first two methods for a given port, the US West Dex Internet Yellow Pages were used to locate a fuel dock at that port.
    4. In some cases, the Port Office is called in lieu of a fuel dock, per se.
    5. If, over the course of the data collection, a fuel dock is discovered to be somehow inappropriate for this collection (e.g., the dock is a subsidiary of another dock surveyed) the inappropriate fuel dock will be excluded from further data collections.
    6. If, over the course of the data collection, a new fuel dock is identified as a more appropriate fuel dock than the one currently being surveyed, the new dock will replace the old dock in future collections. However, the new fuel dock will be assigned a new fuel dock identifier.
    7. If, over the course of the data collection, a new fuel dock is identified as being a useful contributor to this collection, the fuel dock will receive a new fuel dock identifier and be added to future data collections.
    [Overview] [Port Selection Method] [Selected Ports] [Fuel Docks] [Alaska Fuel Prices] [California Fuel Prices] [Download Data Page]
    [Data Collected] [Date of Collection] [Data Availability] [Data File Structure] [Oregon Fuel Prices] [Washington Fuel Prices] [Top of This Page]

    West Coast Fuel Prices: Price Data Collected

    The data to be collected are the cash price before tax (where applicable) of 600 gallons of #2 marine diesel.

    If the before tax price is not available, (i.e., the fuel dock cannot/will not provide before tax price,) the pre-tax price will be calculated and a note will be made in the "notes" column.

    [Overview] [Port Selection Method] [Selected Ports] [Fuel Docks] [Alaska Fuel Prices] [California Fuel Prices] [Download Data Page]
    [Data Collected] [Date of Collection] [Data Availability] [Data File Structure] [Oregon Fuel Prices] [Washington Fuel Prices] [Top of This Page]

    West Coast Fuel Prices: Data Availability

    Fuel price data will be available by state or in a combined West Coast/Alaska file.

    These data will be entered made available on the FishEcon website in SPSS and ASCII formats by the second Tuesday of each month, but no earlier than the first Thursday of the month.

    [Overview] [Port Selection Method] [Selected Ports] [Fuel Docks] [Alaska Fuel Prices] [California Fuel Prices] [Download Data Page]
    [Data Collected] [Date of Collection] [Data Availability] [Data File Structure] [Oregon Fuel Prices] [Washington Fuel Prices] [Top of This Page]

    West Coast Fuel Prices: Data File Structure and Variable Formats

    West Coast fuel price data are available in 2 formats: as a SPSS file and as an ASCII fixed width file. Each file contains the following variables:

    Variable Type Width Variable Title Data Values/Notes
    Year Numeric 4.0 Year of fuel price collection -
    Month Numeric 2.0 Month of fuel price collection 1=January, 2=February, etc.
    Day Numeric 2.0 Date of fuel price collection -
    Port Character 3 PacFIN port code Click here for more info on PacFIN
    PortName Character 30 Name of port -
    State Character 2 State in which port is located 2-letter US Postal Service official abbreviation
    DockCode Character 4 Fuel dock identifier Click here for more info on fuel dock identifiers
    Pricettl Dollar 10.2 Total cash price before tax of 600 gallons of #2 marine diesel in current US dollars Pricettl=$0.00 indicates that a total price was unavailable for this fuel dock
    $0.00 set to user missing value in SPSS data file
    Pricegal Dollar 6.6 Cash price per gallon before tax of 600 gallons of #2 marine diesel in current US dollars Pricegal=$0.000 indicates that a total price was unavailable for this fuel dock
    $0.000 set to user missing value in SPSS data file
    PxQuoted Numeric 1.0 Which price was quoted 0 = No Price Quoted - See Notes
    1 = Price per Gallon Quoted
    2 = Total Price Quoted
    3 = Both Prices Quoted
    Notes Character 50 Any notes related to anomalies, exceptions, caveats, etc associated with the data in the record -
    [Overview] [Port Selection Method] [Selected Ports] [Fuel Docks] [Alaska Fuel Prices] [California Fuel Prices] [Download Data Page]
    [Data Collected] [Date of Collection] [Data Availability] [Data File Structure] [Oregon Fuel Prices] [Washington Fuel Prices] [Top of This Page]

    OVERVIEW | SURVEYS | DATA | RESOURCES | COMMUNITY PROFILES | LINKS | FORUM

    Return to Fisheries Economics Data Program Home
    Search | Contacts | Site Map | Feedback

    Friday, 02-Mar-2012 10:33:36 PSTOverviewSurveysDataResources and PublicationsLinksForumContactsSearch FishEconFeedbackReturn to FishEcon Home